There are many thermal analysis methods available to investigate the physical properties of various substrates and adsorbents. Samples are subjected to programmed temperature exposure and data is gathered as a function of temperature. In many industries, thermal analysis techniques are increasingly essential for industrial research and quality control purposes.

Image Credit: Shutterstock/Roman Zaiets
Using temperature programmed desorption (TPD) or thermal desorption spectrometry (TDS), the surface composition of a substrate can be characterized. This type of analysis allows the user to investigate the kinetics of adsorption through the dissociation of gases adsorbed on surfaces. When a sample in a vacuum chamber is heated, its molecules gain enough energy to surpass the activation barrier. This leads to desorption.
The adsorbents leave the surface in gas form due to temperature increase. A mass spectrometer is then used to analyze the adsorbents. The users can determine the temperatures at which desorption takes place and target analytes' binding energies by mapping the temperature increase while observing the mass spectrum.
The quantitative and qualitative data of the atomic and molecular samples that have been annealed upon the surface of the analyzed substrate can be obtained from the analysis of the resulting spectra. Data from known adsorbents can be analyzed and quantified, and the existence of trace amounts of contaminants within a sample matrix can be identified using TDS.
Process Insights’s TPD Systems
Process Insights offers a variety of instruments and solutions to achieve accurate and reproducible TPD results. One such product is the Veraspec TDS, a turnkey system with sample introduction, high sensitivity detection, and controlled thermal management features.
Bespoke TPD systems are also offered by Process Insights for more specific research. The State Key Laboratory of Molecular Reaction Dynamics, Dalian Institute of Chemical Physics, China, has one such system, which is equipped with Process Insights’ most sensitive MAX-50 quadrupole analyzer and is employed for the surface chemistry analysis, particularly photocatalytic activity of rutile TiO2 surfaces and their reactions with water and methanol (Figure 1).
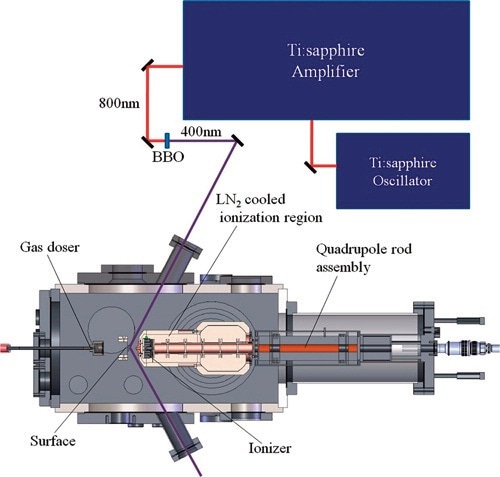
Figure 1. Schematic diagram of the photocatalysis-TPD mass spectrometer. Note that the laser source did not come from Process Insights
Rutile and antase TiO2 materials are often employed in the study of hydrogen production by photocatalytic water splitting. This article focuses on the results collected using Process Insights’ mass spectrometer to analyze the quantitative and qualitative results of photocatalytic process studies.
The TPD spectrometer shown in Figure 1 is highly sensitive and is intended for photocatalytic process studies on a single crystal. The ultra-high vacuum (UHV) system has a main probing chamber operating at a base pressure of 6x10-11Torr. The vacuum system is above the main chamber and consists of the preparation and characterization chamber to clean and check the TiO2 (110) crystals for contamination.
Process Insights’ MAX-50 quadrupole mass spectrometer employs an electron impact (EI) ionizer in an extremely high vacuum region of 1.5x10⁻¹²Torr. Emission current of 2-3mA and electron energy of 60-70eV were applied during the experiments. A copper shield cooled by a double-layer liquid nitrogen cryopump surrounded the ionization region to adsorb low vapor pressure residual species and slow down outgassing from chamber walls.
A 4-mm pinhole connects the ionization chamber to the main chamber from the front of the ionizer, and the ions are led to the quads from the back of the optics region by a 5-mm pinhole. A titanium sublimation pump (Varian) surrounded by a double-layer liquid nitrogen Dewar was used to pump high vapor pressure residual gasses in order to achieve better vacuum. The background was reduced anywhere from 6-200 times using these additional pumps based on the mass chosen to investigate and improve determination of radical species and residual gases.
The following are the needs of a TPD system:
- Analysis time relating to desorption rate
- Relation of adsorbate concentration to partial pressure
- Accurate desorption curves in order to relate to reaction kinetics
The following are the advantages of Process Insights’ TPD systems:
- Minimal signal fluctuations can be detected owing to the high accuracy and sensitivity of Process Insights’ TPD systems
- Process Insights' mass spectrometer enables fast, real-time analysis to relate to accurate temperature relations as temperature ramps are often in the range of 1-10K/sec.
- Desorption curves can be used to target binding energies with Process Insights' mass spectrometers.
Experimental Procedure
This experiment involved dosing the TiO2 (110) surfaces with CD3OH (Aldrich, 99.9%), purified by a number of freeze/pump/thaw cycles, and introducing to the surface with a calibrated molecular beam doser prior to exploiting to laser irradiation. Figure 7 clearly demonstrates the high sensitivity of the mass spectrometer owing to easy manipulation of different water TPD states by the photon flux. Figure 2b shows an increase in peak area, revealing the concentration increase of O-vacancy with a photon flux increase.
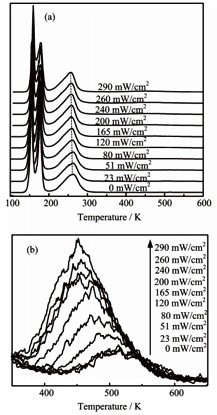
Figure 2. (a) Here the TPD spectra of the 2.9ML H2O dosed TiO2 (110) surface is shown as a function of pre-irradiated power with 266nm for 90s. (b) Close up view of the change in the 500K peak as a function of pre-irradiated power.
Figure 3A shows a peak resulting from the dissociative ionization of the desorbed parent molecule, CD3OH. The spectrum in Figure 3B is believed to be arrived from three possible sources. The most intense peak around 270K is CD2O. CD3OH and CD3OD represent the remaining lump in the spectrum and are desorbed around 300K.
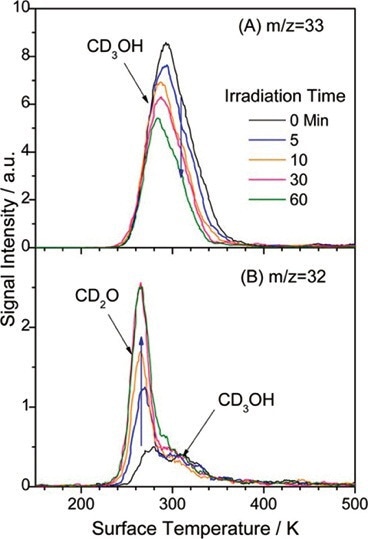
Figure 3. (A) TPD spectra at m/z = 33 (CD2OH+). It can be seen that peak intensity decreased with increased laser irradiation times. Conversely, in (B), m/z = 32 (CD2O+) signal increases with laser irradiation time.
A similarity can be observed between the resulting TPD spectra and the TPD peak of H2O, which is a result of H atoms known to adsorb on the bridge-bonded oxygen (BBO) sites of the TiO2 (110) surface. This implies that the TPD signals of the water isotopologues are from H and D atoms dissociating from BBO sites (Figures 4 and 5).
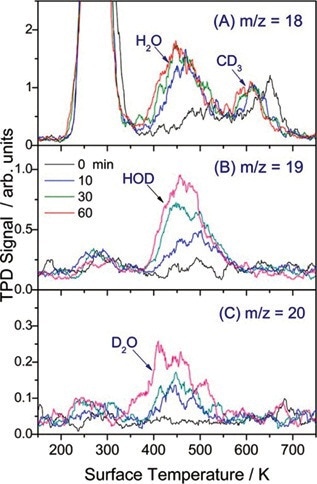
Figure 4. TPD spectra of m/z = 18 (H2O+, CD3+), 19 (HOD+), and 20 (D2O+) showing photocatalysis of CD3OH/TiO2 over varied laser exposure.
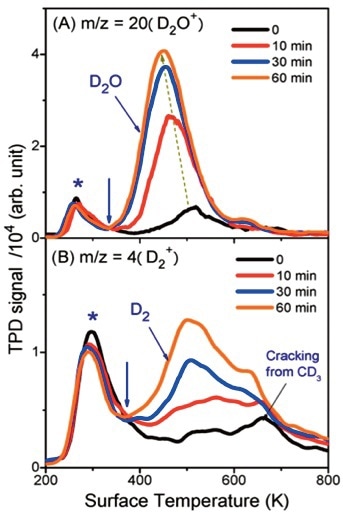
Figure 5. (A) TPD spectra of m/z = 20 (D2O+) collected after 400nm laser irradiation at different times. The peak near 300K (marked with *) is said to be the dissociative ionization signal of molecular adsorbed CD3OD. (B) TPD spectra of m/z = 4 (D2+).
The ability of the mass spectrometer to discern between the two TiO2 (110) surfaces is demonstrated in Figure 6, depicting the impact of the binding of hydrogen or deuterium atoms to the BBO sites on the TPD spectra of CH3OH. The red peak was plotted with the BBO sites saturated, with shifting of the methanol signal to roughly 20K lower in the presence of BBO-H(D).
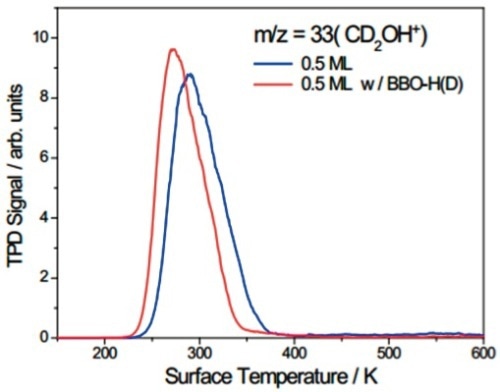
Figure 6. TPD spectra at m/z = 33 (CD2OH+).
In their recent study, researchers at the State Key Laboratory focused on the antase (A)-TiO2 (101) material rather than the rutile (R)-TiO2 (110) substrate. The antase form is considered as the most active polymorph in commercial applications for catalysts.
The reaction process of water and methanol on the rutile surface has been well documented in earlier studies. Researchers were not happy with the lack of efficiency of the R-TiO2 (110) surface as only 7% of D-atoms on the BBO sites were involved in the formation of D2 and the rest recombined with BBO atoms to form D2O.
In this experiment, the photocatalytic chemistry of H2 formation on A-TiO2 (101) is studied. There is a similarity between the spectra of the observed products and those achieved in previous analyses on the R-TiO2 (110) surface, implying the involvement of similar photocatalytic mechanisms in its formation. Following the mechanism from A to B to C, dissociated H atoms are shifted to the BBO sites, providing the reaction conditions for the generation of molecular H2 as a thermally driven reaction (Figure 8).
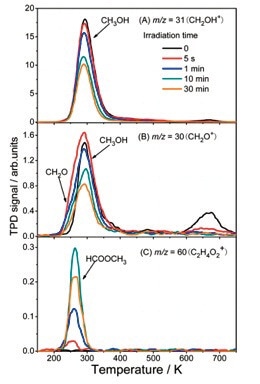
Figure 7. (A) Spectra of m/z = 31 (CH2OH+). (B) Spectra of m/z = 30 (CH2O+). (C) Spectra of m/z = 60 (C2H4O2 +) a signal of the parent ion signal of HCOOCH3. Spectra were collected from a 0.38ML of CH3OH dosed A-TiO2 (101) substrate plotted as a function of irradiation time with a photon flux of 1.9x10¹⁷ photons cm-0.2 s-1.9.
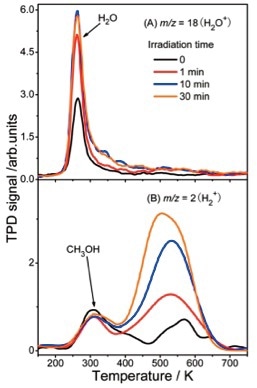
Figure 8. (A)TPD spectra of m/z = 18 (H2O+) and (B) m/z = 2 (H2+) at varied laser irradiation times.
Conclusion
With Process Insights’ mass spectrometry systems, the surface composition of a substrate and the kinetics of adsorption through the dissociation of gases adsorbed on surfaces can be studied. With superior sensitivity, Process Insights’ mass spectrometry systems provide reliable results. Process Insights’ proven MAX-CS range of quadrupole mass spectrometer analyzers and controlled temperature ramping to 1200°C are widely trusted by the scientific community worldwide.
References
- Skoog, Douglas A., F. James. Holler, and Timothy A. Nieman. Principles of Instrumental Analysis. Philadelphia: Saunders College Pub., 1998.
- "Temperature Programmed Desorption." Elettra Sincrotrone Trieste. N.p., n.d. Web. 16 June 2014.
- Guo, Q.; Xu, C.; Ren, Z.; Yang, W.; Ma, Z.; Dai, D.; Fan, H.; Minton, T.K.; Yang, X. “Stepwise Photocatalytic Dissociation of Methanol and Water on TiO2 (110)”. J. Am. Chem. Soc. 2012, 134, 13366-13373.
- Yin, X.-L.; Calatayud, M.; Qiu, H.; Wang, Y.; Birkner, A.; Minot, C.; Wӧll, Ch. Chem. Phys. Chem. 2008, 9, 253-256.
- Xu, C.; Yang, W.; Guo, Q.; Dai, D.; Chen, M.; Yang, X. “Molecular Hydrogen Formation from Photocatalysis of Methanol on TiO2 (110).” J. Am. Chem. Soc. 2013, 135, 10206-10209.
- Xu, C.; Yang, W.; Ren, Z.; Dai, D.; Quo, Q.; Minton, T.K.; Yang, X. “Strong Photon Energy Dependence of the Photocatalytic Dissociation Rate of Methanol on TiO2 (110)”. J. Am. Chem. Soc. ASAP.
- Xu, C.; Yang, W.; Ren, Z.; Dai, D.; Quo, Q.; Minton, T.K.; Yang, X. “Supporting Information for Strong Photon Energy Dependence of the Photocatalytic Dissociation Rate of Methanol on TiO2 (110)”.
- Ren, Z.; Guo, Q.; Xu, C.; Yang, W.; Xiao, C.; Dai, D.; Yang, X. “Surface Photocatalysis – TPD Spectrometer for Photochemical Kinetics”. Chinese J. Chem. Phys. 2012, 25, 5, 507-512.
- Xu,C.; Yang, W.; Guo, Q.; Dai, D.; Chen, M.; Yang, X. “Molecular Hydrogen Formation from Photocatalysis of Methanol on Antase-TiO2 (101).” J. Am. Chem. Soc. 2014, 136, 602-605.
- Henderson, M.A. Surf. Sci. Rep. 2011, 66, 185-297.

This information has been sourced, reviewed and adapted from materials provided by Process Insights - Mass Spectrometry.
For more information on this source, please visit Process Insights – Mass Spectrometers.