Flour is a powder comprising of fine particles that are formed during the grinding or milling of a dry grain. Wheat is commonly used to make flour, however other grains can also be used.
Image Credits: Africa Studio/shutterstock.com
The most common use of flour is to prepare dough for baking different bread products. The optimal use of the flour depends on its protein content, which is one of its chief components. Flour with lower amounts of protein (~8%) is commonly used to make cakes and pastries. Flour with a mid-range amount of protein, (~10%) is classified as all-purpose flour, and flour with higher amounts of protein, (~12%) are categorized as bread flour.
The dietary/nutritional value as well as the quality/category of the flours can only be categorized only precisely determining the protein content in the flours. Usually, the amount of nitrogen in a flour sample and a protein factor multiplier, which varies based on the sample matrix, are the parameters used to calculate the amount of protein in flours and other types of food products.
This article discusses the LECO TruMac N, which is a macro combustion nitrogen/protein determinator (Figure 1). This instrument makes use of a pure oxygen environment in large ceramic boats and a ceramic horizontal furnace for a macro sample combustion procedure.
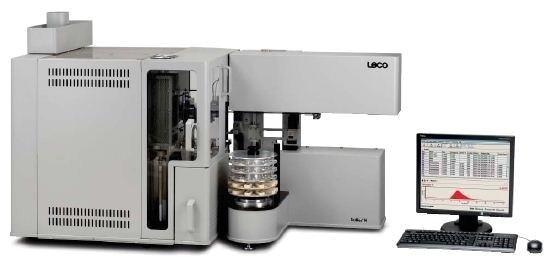
Figure 1. LECO TruMac N
The moisture content of the combustion gas is removed by a thermoelectric cooler, without the need of chemical reagents. A combustion gas collection and handling system is used to take a 3/10 cc volume of combustion gas. This system reduces the quantity of chemical reagents required to scrub and transform the nitrogen oxide combustion gas into nitrogen, which helps to achieve a low-cost-per analysis. The amount of nitrogen in the combustion gas is detected by a thermal conductivity (TC) cell.
Sample Preparation
Samples
Samples of uniform consistency are used to obtain the preferred results.
Accessories
528-203 Crucibles.
Calibration Samples
502-642 Phenylalanine, 502-092 EDTA, and 501-050 Nicotinic Acid.
Analysis Parameters
| Furnace Temperature |
1100°C |
| TE Cooler Temperature |
5°C |
| Dehydration Time |
0s |
| Purge Cycles |
2s |
Instrument Model and Configuration
Thermal conductivity detectors detect the changes in the thermal conductivity of the analytical gas, compared to the constant thermal conductivity of a reference gas. The sensitivity of the detector is greater when there is a greater difference between the thermal conductivity of the analyte gas and that of the carrier gas. The LECO TruMac N comes in different models, supporting the use of either argon or helium as the carrier gas for the TC cell.
Helium has the highest sensitivity when being used as a carrier gas, yielding the highest performance at the lower end of the nitrogen range. Helium models also provide the benefit of replacing the 10 cc aliquot loop with a 3 cc aliquot loop inside the combustion gas collection and handling system. The 10 cc aliquot loop enables the lowest nitrogen range and best accuracy for the instrument. Compared to the 10 cc aliquot loop, the 3 cc aliquot loop increases the reagent life expectancy by approximately three fold, and ensures the lowest cost–per-analysis and reduced impact on practical application performance.
The argon model has been developed using argon as the carrier gas due to the recent dip in supply and availability of helium gas. As the difference in thermal conductivity between nitrogen and argon is not as great as that between nitrogen and helium, the detector is less sensitive when argon is used. The argon model has a practical application performance, identical to that of the helium model when it is operated with the equivalent method and instrument configurations.
Element Parameters
Following are the parameters for helium and argon gases:
| |
Helium
10 cc and 3 cc |
Argon
10 cc |
| Baseline Delay Time |
6s |
6s |
| Minimum Analysis Time |
35s |
55s |
| Endline Time |
2s |
2s |
| Conversion Factor |
1.00 |
1.00 |
| Significant Digits |
5 |
5 |
| TC Baseline Time |
10s |
10s |
Burn Profile
| Burn Cycle |
Lance Flow |
Purge Flow |
Time (s) |
| 1 |
Off |
On |
5s |
| 2 |
On |
On |
35s |
| 3 |
On |
Off |
END |
Ballast Parameters
Ballast
| Equilibrate Time |
30s |
| Not Filled Timeout |
300s |
Aliquot Loop
| Equilibrate Pressure Time |
4s |
| High Precision |
Yes |
| High Speed |
No |
Experimental Procedure
- Use the operator’s instruction manual to prepare the instrument for operation.
- Analyze 3-5 blanks to condition the system (crucible is not required).
- To determine the blank, perform the following steps:
- Use Blank as the sample name, and enter a 1.0000g mass into the Sample Login (F3).
- At the appropriate position of the autoloader, place a 528-203 Crucible.
- Repeat the steps 3a and 3b at least three times.
- The analysis sequence (F5) should be initiated.
- Use the procedure provided in the operator’s instruction manual to set the blank.
- To perform calibration, complete the following steps:
- About 0.75 g of the EDTA calibration sample should be placed into the 528-203 crucible, and the sample and mass identification needs to be entered into the Sample Login (F3).
- The crucible should be transferred to the appropriate position of the autoloader.
- Steps 4a and 4b should be repeated at least three times.
- Initiate the analysis sequence (F5).
- The instrument should be calibrated using the procedure outlined in the operator’s instruction manual, using the single standard calibration.
Here, it should be noted that multi-point (fractional weight or multiple calibration samples) can be used for calibration. It has been proven that a properly functioning TruMac can be calibrated using multiple replicates of a single mass range (nominal 0.75 g) of EDTA using just one standard calibration. This is a simple and cost-effective procedure. The calibration can be validated by studying different types of compounds such as phenylalanine (0.5-0.75 g) and nicotinic acid (0.25-0.5 g).
- Samples should be analyzed using the following steps:
- About 1 g of flour sample should be placed in the 528-203 crucible, and the sample and mass identification should be entered into the Sample Login (F3).
- The crucible should be transferred to the appropriate position of the autoloader.
- Steps 5a and 5b should be repeated for each sample to be analyzed.
- The analysis sequence (F5) should be initiated.
Another point to be noted here is that when carbon black (soot) is formed in the primary filter (steel wool filter), sample mass should be reduced to prevent build-up of soot in the filter. Soot is produced when large amounts of certain types of samples are analyzed.
Typical Results
| |
3 cc Helium |
10 cc Helium |
10 cc Argon |
| |
Mass(g) |
%N |
Mass(g) |
%N |
Mass(g) |
%N |
| LECO 501-563 |
1.0194 |
1.21 |
1.0070 |
1.21 |
1.0392 |
1.20 |
| Lot: 1014 |
1.0272 |
1.20 |
1.0069 |
1.20 |
1.0140 |
1.20 |
| 1.21±0.02 |
1.0221 |
1.20 |
1.0104 |
1.20 |
1.0401 |
1.20 |
| Corn Flour |
1.0490 |
1.20 |
1.0630 |
1.20 |
1.0289 |
1.20 |
| |
1.0275 |
1.20 |
1.0708 |
1.20 |
1.0091 |
1.20 |
| |
Avg = |
1.20 |
Avg = |
1.20 |
Avg = |
1.20 |
| |
s= |
0.004 |
= |
0.004 |
= |
0.003 |
| LECO 502-274 |
1.0658 |
2.74 |
1.0176 |
2.75 |
1.0038 |
2.74 |
| Lot: 101 1 |
1.0209 |
2.74 |
1.0069 |
2.75 |
1.0389 |
2.75 |
| 2.75±0.02 |
1.0994 |
2.74 |
1.0107 |
2.76 |
1.0123 |
2.75 |
| Wheat Flour |
1.0157 |
2.75 |
1.0265 |
2.74 |
1.0135 |
2.74 |
| |
1.0091 |
2.75 |
1.0115 |
2.74 |
1.0377 |
2.74 |
| |
Avg = |
2.74 |
Avg = |
2.75 |
Avg = |
2.74 |
| |
s= |
0.005 |
s= |
0.008 |
s= |
0.005 |
| LECO 502-275 |
1.0044 |
1.73 |
1.0108 |
1.73 |
1.0118 |
1.72 |
| Lot: 1007 |
1.0080 |
1.72 |
1.0042 |
1.74 |
1.0312 |
1.72 |
| 1.74±0.06 |
1.0217 |
1.73 |
1.0194 |
1.74 |
1.0209 |
1.72 |
| Rye Flour |
1.0429 |
1.73 |
1.0421 |
1.73 |
1.0562 |
1.72 |
| |
1.0314 |
1.72 |
1.0114 |
1.73 |
1.0241 |
1.73 |
| |
Avg = |
1.73 |
Avg = |
1.73 |
Avg = |
1.72 |
| |
s= |
0.005 |
= |
0.005 |
s= |
0.004 |
| LECO 502-278 |
1.0629 |
1.17 |
1.0465 |
1.17 |
1.0172 |
1.17 |
| Lot: 1013 |
1.0398 |
1.17 |
1.0182 |
1.17 |
1.0896 |
1.17 |
| 1.17±0.05 |
1.0384 |
1.17 |
1.0323 |
1.17 |
1.0170 |
1.17 |
| Rice Flour |
1.0560 |
1.17 |
1.0760 |
1.17 |
1.0689 |
1.17 |
| |
1.0220 |
1.17 |
1.0580 |
1.17 |
1.0371 |
1.17 |
| |
Avg = |
1.17 |
Avg = |
1.17 |
Avg = |
1.17 |
| |
s= |
0.002 |
= |
0.001 |
s= |
0.001 |

This information has been sourced, reviewed and adapted from materials provided by LECO Corporation.
For more information on this source, please visit LECO Corporation.