The MAX300-EGA™ is an advanced quadrupole mass spectrometer (Figure 1). It is integrated with a heated transfer line that enables evolved gas analysis and is linked to the off-gas port of a NETZSCH® TG 209 F1 Libra® thermobalance (Figure 2). A number of samples were tested and the combination of the two technologies enabled real-time quantitative analysis and thermal characterization of the compounds in the furnace exhaust.
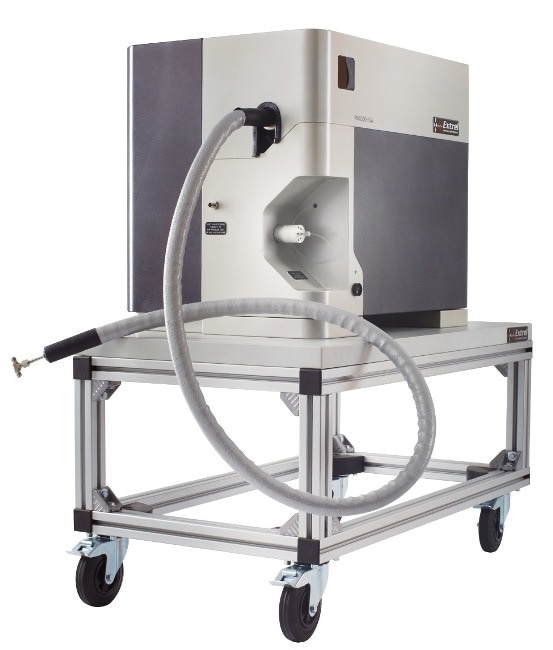
Figure 1. The MAX300-EGA, a quadrupole mass spectrometer optimized for evolved gas analysis.
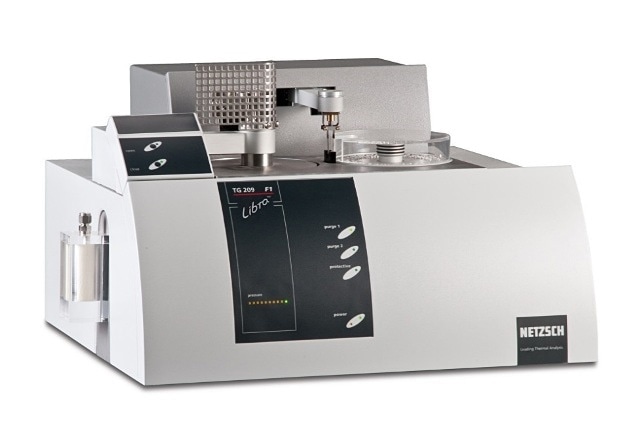
Figure 2. The NETZSCH TG 209 F1 Libra configured with the heated off-gas assembly.
For many years, the powerful technique of thermogravimetric analysis (TGA), has been used to characterize liquid and solid samples. The sample material’s mass is tracked while it is heated. Applying a high accuracy balance along with cautious control of the heating procedure can allow researchers to plot the loss of mass as a function of temperature. TGA is extensively applied in the analysis of polymers, petrochemicals, and pharmaceuticals to establish degradation temperatures, track moisture content and solvent, and characterize thermal decomposition. Supplementary data regarding sample composition and thermal performance can be acquired by testing the gases that leave the material as it is heated. The researcher is then able to establish the temperature at which a mass loss happens, as well as the molecular structures involved.
Evolved gas analysis (EGA) is usually performed via a number of analytical methods, but in all cases it is important to protect and maintain the reliability of the gas stream. It has to be kept hot and transferred instantly to the gas analyzer, to avoid chemical interactions and condensation.
NETZSCH TG 209 F1 Libra
The NETZSCH TG 209 F1 Libra is a sophisticated vacuum-tight TGA, which can be used to link to a mass spectrometer. It is fitted with an automatic sample changer and is capable of reaching temperatures as high as 1100°C. The Libra determines sample mass to a resolution of 0.1 µg.
The heated adapter of the Libra was linked to the Process Insights MAX300- EGA transfer line. The interface is pumped differentially for rapid clearing and then heated to 200°C to avoid condensation. It offers a low volume, chemically-inert sample path from the TGA right into the ionizer of the mass spectrometer.
The MAX 300-EGA is a quadrupole mass spectrometer that has been designed for evolved gas analysis in a lab setting. It can scan from 1 to 500 amu and includes the Process Insights 19 mm mass filter for long term stability and superior analytical repeatability. The Questor5 software enables the system to carry out quantitative testing, measuring concentrations from 100% down to 10ppb, and qualitative testing for sample characterization. In addition to the transfer line, the MAX300-EGA is fitted to import a start-of-heating signal from the TGA, and can be designed to conduct trend data and calculations or output the data for observation and manipulation on a diverse platform.
Polystyrene Decomposition: Detection of High-Mass Fragments
The Libra’s furnace was loaded with 0.94 mg of polystyrene and heated over 600°C. Sample breakdown was tracked to establish the sensitivity of the MAX300 to small signals produced by high-mass hydrocarbons in the off-gas. Although the TGA reports the polystyrene decomposition as a single weight loss starting at 290°C, the MAX300 is able to demonstrate that the evolution of several compounds has happened (Figure. 3. A).
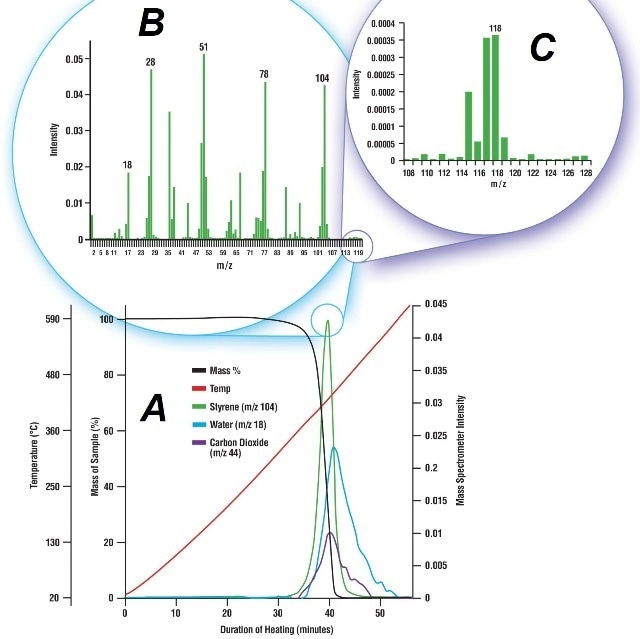
Figure 3. The thermal decomposition of polystyrene. A. Mass loss data from the TGA shown with the intensity trends from the mass spectrometer. Water and carbon dioxide are shown leaving the sample along with styrene. B. The mass spectrum of the evolved gas captured at 39.75 minutes. The peaks at m/z 18, 44, and 104 are from water, carbon dioxide and styrene, respectively. C. A portion of the mass spectrum, rescaled. The peaks at m/z 115 - 128 are from a styrene molecule still bound to a methyl group that has broken off of the parent molecule.
It is usually complicated to maintain larger molecules from falling off of an evolved sample once it has been removed from the furnace, however at 39.75min the mass spectrum clearly reveals the presence of styrene in the off-gas (Figure. 3. B), as well as the much smaller signal produced by methyl styrene (Figure. 3. C). The mass of each part in the gas was measured to compare with the data from the TGA's balance (Table 1).
Table 1. The quantitative analysis mode of the MAX300-EGA was used to calculate the mass of each analyte in the off-gas. These values are shown with the mass loss measured by the TGA.
| MAX300-EGA |
Mass Loss (µg) |
| Component |
1 |
2 |
3 |
| Water |
60.05 |
|
|
| Carbon Monoxide |
|
60.73 |
|
| Carbon Dioxide |
|
34.38 |
149.09 |
| Mass Spec Sum |
60.05 |
95.11 |
149.09 |
| TGA Data |
59.93 |
94.61 |
150.96 |
The mass spectrometer was able to measure and quantify the fairly small 60 µg loss that occurred as moisture evaporated from the sample. The MAX300 was also able to independently establish the quantity of carbon dioxide and carbon monoxide that integrated and resulted in the second mass loss. While the thermal breakdown of calcium oxalate is properly documented (Figure 4), the MAX300’s ability to execute comparable quantitative separations can be applied to gain a better understanding of a multifaceted decomposition featuring the concurrent evolution of numerous unidentified compounds.
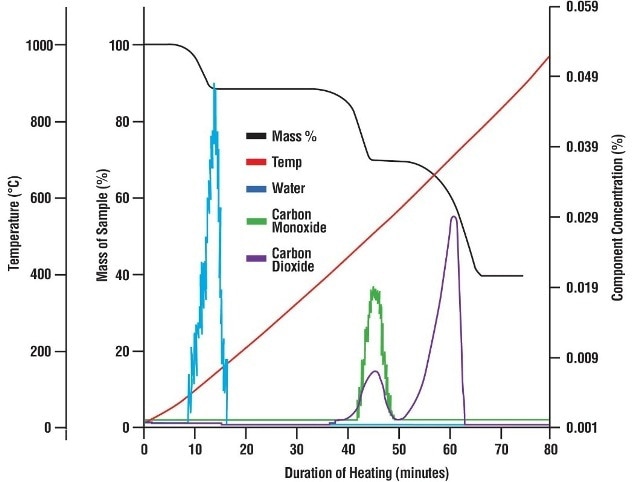
Figure 4. The mass loss of the calcium oxalate sample shown with thermal data and the composition of the off-gas as recorded by the mass spectrometer. Three weight losses occurred during the test.
Conclusion
The data collected from the effluent of the TGA 209 F1 Libra shows that the MAX 300-EGA is indeed a robust tool for evolved gas testing. The resolution, sensitivity, and quantitation showcased during the tests point to the instrument's potential for other evolved gas applications. The MAX 300-EGA, in its basic configuration, or fitted with the 300 or 400°C transfer line upgrades, can be applied to measure the loss of solvent in a pharmaceutical sample, identify trace VOCs, or track the gas emitting from a microreactor.

This information has been sourced, reviewed and adapted from materials provided by Process Insights - Mass Spectrometry.
For more information on this source, please visit Process Insights – Mass Spectrometers.