The demand for water supplies and tighter regulations has increased, resulting in more studies being performed on water treatment processes.
The scope of these studies include optimizing filtration processes to reduce membrane fouling and eliminate biological contaminants, enhancing processes to enable the treated water to be employed in secondary application, and tracking the filter breakthrough to reduce contamination and maintenance needs, and validating the ability to prevent the rising load of nano-particulates in the waste water stream.
Due to the huge volumes processed, even slight improvements in process efficiency and performance can have a major effect on the resulting energy consumption and water quality.
Among the various technologies available to track particle size and concentration the micron size range, nanoparticle tracking analysis (NTA) is recognized as an advanced technology that provides a better understanding about the sub-micron size range, which is imperative for many water treatment processes (Figure 1).
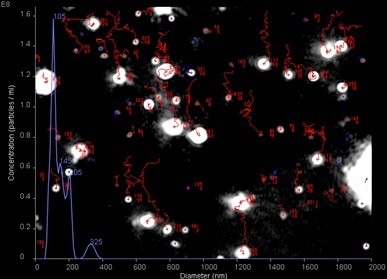
Figure 1. Tracking of particles by NTA software to derive the particle size distribution.
Detecting and Counting Particles
NTA and dynamic light scattering (DLS) can both determine the Brownian motion of nanoparticles. In NTA, laser light disperses from suspended particles and the images of these particles moving under the Brownian motion are captured by a video camera. By monitoring and measuring the diffusion of particles, the diameter of the particles can be established using the Stokes-Einstein equation.
Qualifying Filtration Processes
NTA was used by Ling and team to determine particle (50 - 500 nm) concentration downstream and upstream of a filter to measure the filtration efficiency of a model membrane filter, to purify and disinfect the drinking water and also to remove nanoparticles from pure chemicals.
Within a specific concentration limit, NTA measurements were consistent, and experimental results were similar with the data previously published and acquired with an aerosolization technique. This confirms the capability of the NTA method.
Microfiltration (MF) can be used to pre-treat other processes like ultrafiltration (UF) or post-treat granular media filtration. It is imperative to track and qualify the filtration process performance to optimize the process conditions.
Finer sizes like engineered nanoparticles and viruses can be removed in the later stages of treatment, producing only dissolved materials. Treatment processes comprise of reverse osmosis (RO), MF, and ultraviolet (UV) treatment.
The example described below shows the increasingly lower concentrations (y axis) and the reducing peak size. MF was able to remove particles in the 10's to 100's of nanometer range, and RO eliminated most of the remaining particles. Following UV treatment, no particles were visable with the NTA technique (Figure 2).
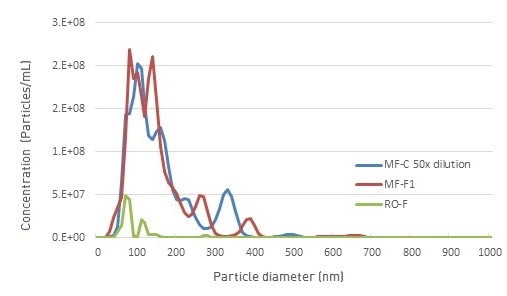
Figure 2. The concentrated retain side of the microfilter (MF-C) was approximately 50 times higher concentration than the inflowing feed water stream (MF-F). Post microfilter, the feed to the RO (RO-F) was an order of magnitude lower again.
The RO filter rinse showed higher concentrations of background material, although particles were still below the NTA detection limit. Other tests revealed that the total bacteria concentration was slightly increased across the same samples with a distinct increase of total carbohydrates and proteins.
Studying Membrane Fouling
MF and UF are low-pressure membrane methods and are suitable for subsequent stages of water treatment. They provide several benefits over traditional filtration procedures due to a small footprint, reliability in operation, and high water quality effluent.
As tertiary treatments, MF and UF could be used to remove pathogens and particles. The downside of these processes is membrane fouling, which requires frequent chemical cleaning. This reduces membrane life time and increases operational costs.
A study was performed to examine the fouling behavior of the treated domestic wastewater by counting and sizing its submicron components with the NTA technique, and to discover a relationship between filtration performance and colloidal loads of low pressure membranes.
The results suggested that both pre-treatment processes of pre-ozonation and coagulation have to be improved to reduce the fractions that contribute to membrane fouling. Additional tests were performed to compare pre- and post-filtration concentrations of nanoparticles.
Both tests were performed in pilot-plant experiments and lab experiments, where the NanoSight instrument was continuously run for two months and measurements were recorded every 15 minutes.
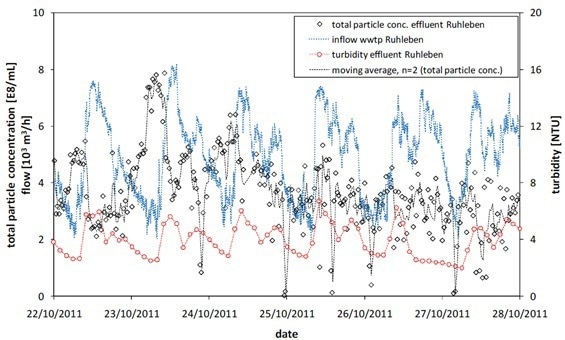
Figure 3. Daily variation of wastewater inflow and corresponding total particle concentration (by NTA) and turbidity in the effluent.
They concluded that particle analysis by NTA was achieved to provide reproducible and reliable information about the size distributions and concentration of the colloidal fraction in the treated and tested domestic wastewater.
The difference in colloid concentration can be a reliably detected between 1 x 10E8 and 2 x 10E9 particles/mL even in inorganic-rich matrices.
Conclusion
NTA serves as an important tool to qualify and track the various filtration processes. Most of these applications can reduces costs if the process is improved.
Membrane fouling can be reduced with the correct use of coagulants and other pre-treatments. Such treatments also benefit from process improvement to minimize chemical usage and track incident concentrations of nanoparticles.

This information has been sourced, reviewed and adapted from materials provided by Malvern Panalytical.
For more information on this source, please visit Malvern Panalytical.