Using Metal Injection Molding (MIM) to manufacture complex shaped metal parts is a growing industry. The size and shape of metal powders play a vital role in determining the process efficiency and properties of the final MIM components.
Looking to achieve best tolerances and properties in final components, MIM manufacturers typically favor spherical powder particles. Therefore, atomized powder should be monitored to ensure that particles of desired size and shape are produced.
The MIM process is used for manufacturing complex-shaped, low weight, high volume parts where complex details may be needed along with accurate tolerance control. The MIM process involves four vital steps which are outlined below:
- Atomization of molten metal to produce metal powders which are further processed by sieving and/or gas classification to obtain the appropriate particle size distribution. This is followed by mixing the powder with thermoplastic binders to form pellets of feedstock ready for the next step.
- Feedstock is injected into a die or mold to form ‘green’ metal injection molded parts.
- The binder is then removed from the ‘green’ part by solvent and/or thermal processes to leave a ‘brown’ metal part.
- The ‘brown’ part is subjected to a sintering process in a high-temperature furnace where the metal particles fuse together. During this stage, particle size is significant but so is particle shape because a higher packing density is exhibited by spherical powders. This means faster sintering times, more touching surfaces, and reduced shrinkage resulting in improved dimensional control. Therefore, the shape and size of the original metal particles produced in step 1 will impact the final product and need to be carefully controlled.
This article shows how atomized powders with similar particle size distributions produced by two different atomizing processes, can have extremely different shape properties and how such parameters can be examined using automated image analysis.
Materials and Methods
To determine both shape and size, a Morphologi G3 was used to analyze two powder batches of stainless steel alloy 17-4PH (Sandvik Osprey Ltd, -32 mm grade) produced by varied atomization techniques . The Morphologi G3 is a automated particle characterization instrument that disperses the powder particles on a glass substrate using an integrated dry powder disperser.
The instrument then scans the sample underneath the microscope optics to capture images of individual particles and carries out image analysis to establish shape and size parameters. Sample A was prepared by a gas atomization process and sample B was prepared by a water atomization process.
An aliquot of each sample was automatically dispersed and analyzed according to a standard operating procedure (SOP), which contained all of the software and hardware variables for the measurement.
Dispersion using the integrated sample dispersion unit (SDU) of the Morphologi G3 was made by applying a pulse of positive pressure on the sample at 4 bar for 8 microseconds and then allowing the sample to settle for 240 seconds.
A 20x objective was used for analysis combined with a 3 plane z-stack. Images of touching particles were not included in the results. More than 55000 particles were characterized for each sample. The samples dispersed well, as can be seen from the field of view images displayed in Figure 1.
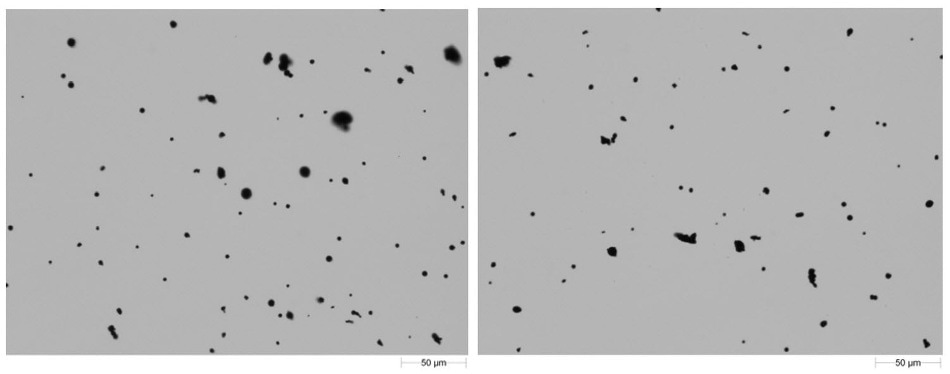
Figure 1. Field of view images of the two dispersed atomized metal samples with Sample A (left) and Sample B (right)
Results and Discussion
The Morphologi G3 software’s comparison tool was used to compare the results. The parameter variability chart, illustrated in Figure 2, shows how each of the morphological parameters assessed differ between the two samples.
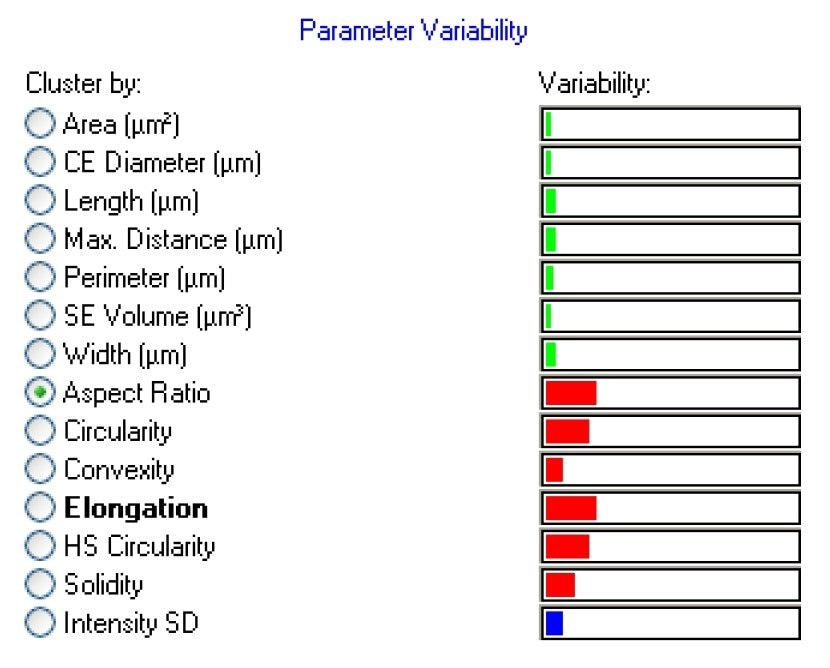
Figure 2. Parameter variability plot showing the degree of difference between the two metallic powder samples for each parameter analyzed
The red bars are related to particle shape and green bars to particle size. The degree of difference between the samples for each parameter is indicated by the length of each bar. While there are minimal differences between the two samples in terms of the size parameters, there are differences in terms of some of the shape parameters, specifically elongation or aspect ratio.
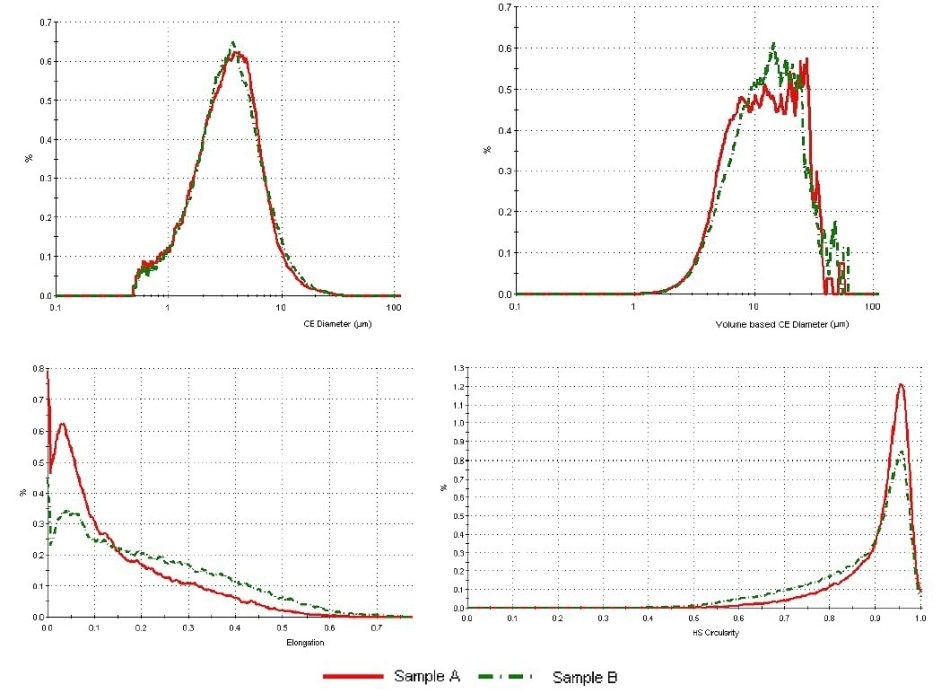
Figure 3. Overlays of some size and shape parameters. Samples A and B are very similar in terms of CE Diameter (both in number and volume weighting) but differ in terms of Elongation and HS Circularity.
These observations are confirmed by the distributions depicted in Figure 3. The samples are very similar in terms of circular equivalent (CE) diameter on both a volume-weighted basis and a number-weighted basis. CE diameter is the diameter of a circle with the same area as the particle image.
However, sample A formed by the gas atomization process is more circular and less elongated than sample B formed by the water atomization process. Elongation is a measure of the width to length relationship of the particle. A higher elongation will be presented by a more needle like particle.
High Sensitivity (HS) circularity is a measure of how close the 2D particle image is to a perfect circle. A perfect circle has a HS circularity of 1, and any deviations from a circle will decrease the HS circularity value. Particles produced by water atomization show a more irregular shape than those produced by gas atomization.
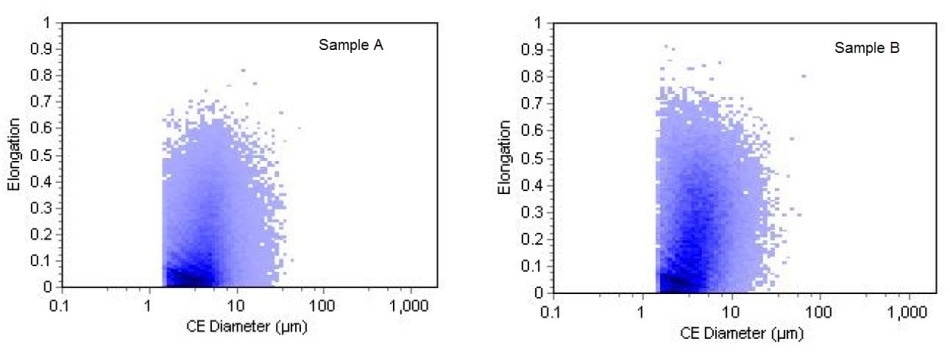
Figure 4. Scattergrams of CE Diameter vs. Elongation
The scattergrams of CE Diameter versus Elongation for the two samples are shown in Figure 4. Comparison of the two scattergrams clearly shows the differences in Elongation across the particle size range which may indicate a fundamental difference in the particle shape produced by the two atomization techniques, rather than an agglomeration or fusing effect contributing to the difference in particle shape.
An image of every particle measured is captured and retained during an analysis. The software enables regions of interest to be selected in the scattergram, and the images of the particles fitting the region are shown.
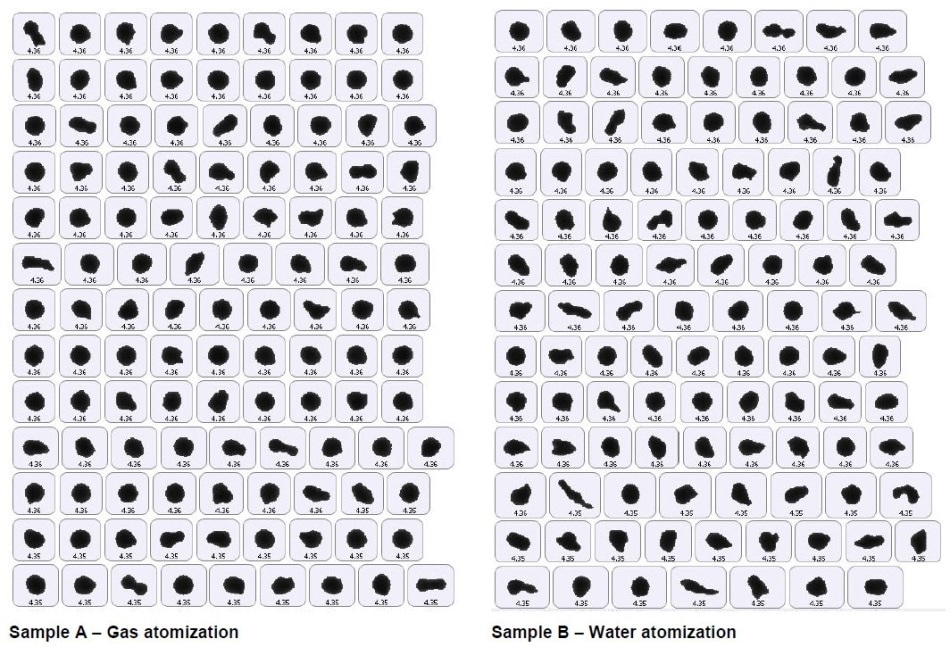
Figure 5. Example images of particles from around the modal size value (individual CE Diameter (µm)) indicated
Figure 5 displays examples of particle images from around the modal size for both of the samples. A visual inspection of the images confirms that more irregular particles are present in the water atomized sample than in the gas atomized powder.
Differences in particle shape were identified between the samples, although both of the samples have the same particle size. Higher packing density found in more spherical powders will typically enhance sintering, decrease shrinkage, and improve physical properties of the final MIM component.
Conclusion
In a metal injection molding process, the properties of the final part can be affected by the shape and size of the particles produced during the atomization step. Automated image analysis enables efficient analysis of the powder, allowing users and manufacturers to monitor powder properties and thus optimize their processes.
References
1. ISO 13322-1 (2014) Particle size analysis - Image analysis methods - Part 1: Static image analysis methods
2. Willen U (2010) Automation in Image Analysis for Particle Size and Shape Measurement - Application Whitepaper, GIT Laboratory Journal

This information has been sourced, reviewed and adapted from materials provided by Malvern Panalytical.
For more information on this source, please visit Malvern Panalytical.