The selection of a light or spectroscopy based in-line process analyzer can be a complicated activity, prompting several questions. What is the difference between a spectrometer and a photometer? Which wavelengths need to be monitored for the desired application? Is a UV/VIS, NIR, or MIR analyzer required? Process Insights has conceived a three-step procedure to address these questions and assist in the decision-making process.
Once these questions have been answered, it is possible to undertake a comparison of technologies such as the difference between DG-NIR and FT-NIR, or manufacture specifications such as repeatability.
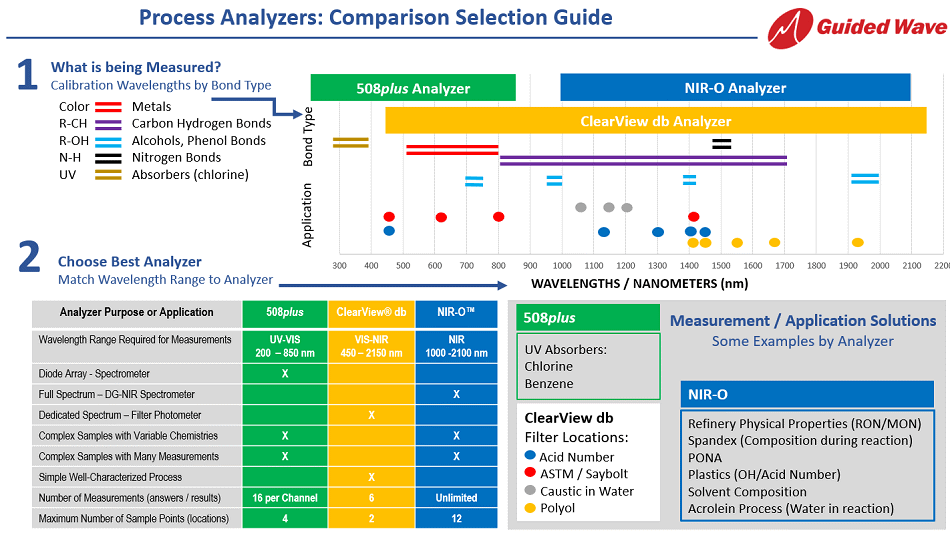
Step 1 - What is Being Measured?
The initial stage in choosing the appropriate analyzer for a process is reached by identifying the properties and chemical species to be monitored. Utilizing the image below, identify the maximum number of wavelengths matching the chemical structures of interest.
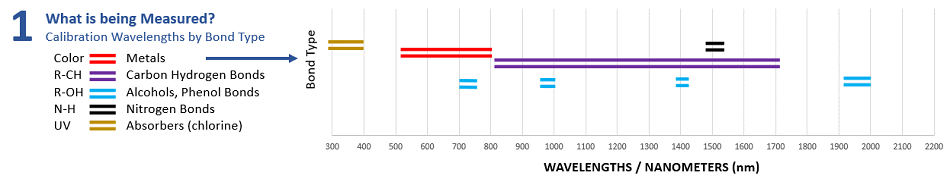
Gold = UV absorbers such as Chlorine; Red = Color and Metal Complex; Blue = Water, Alcohol, and Phenol bonds; Purple = Organic carbon-hydrogen bonds; and Black = Nitrogen Bonds.
508plus Measurement/ Application Solutions - Examples
NIR-O Measurement/ Application Solutions - Examples
- Solvent Composition
- Plastics End-point Monitoring
- Refinery Physical properties (RON/MON and Fuel Identification)
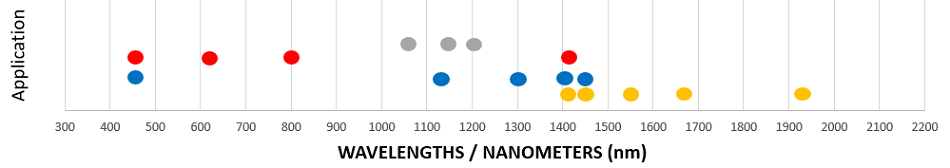
- ASTM or Saybolt Color, yellow represents Polyol and grey represents Caustics in water.
Step 2A - Identify the Corresponding Analyzer
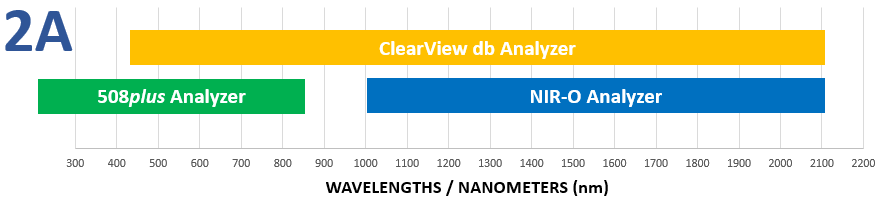
Once the relevant wavelengths have been determined, it is then necessary to match these to an analyzer with which their measurement is possible. The image above demonstrates the wavelength spectrum covered by the NIR-O Full Spectrum Near-Infrared Analyzer, the Dual Beam Clearview Photometer and the UV/VIS 508 Spectrometer. If less than six wavelengths have been pinpointed, then a Clearview DB represents a potential cost-effective option to monitor real-time process conditions.
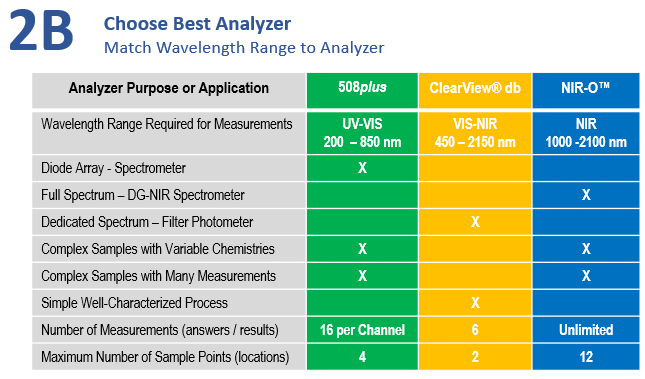
Step 2B - Quick View and Comparison Selection Guide
If there is still uncertainty regarding the optimal analyzer for an application, comparing certain high-level specifications can help. These specifications comprise: wavelength range; technology type; the number of answers or traits that the analyzer can monitor at each sample location; and the number of simultaneous sample points.
Step 3 - Contact a Process Insights Sales Representative
The concluding step can be performed in one of two ways:
- Fill out the Application Questionnaire to supply a Process Insights Sales Representative with all the information that they require to assist with the design of a comprehensive process monitoring solution.
- Complete the Process Insights Contact Us or RFQ Form to receive additional information.

This information has been sourced, reviewed and adapted from materials provided by Process Insights – Optical Absorption Spectroscopy.
For more information on this source, please visit Process Insights – Optical Absorption Spectroscopy.