Titration is an analytical method frequently used within the industry. Manual, semi-automated, and fully automated titrations are popular options and are discussed in-depth in many academic studies.
Several benefits and drawbacks have been identified in an automated titration when comparing it to manual titration, particularly the increase in accuracy of measurements and the significant time and cost-saving that can be made.
How Titration Began
Titration is a principal analytical method that is renowned for being extremely easy to complete. The only required items are a buret, a titrant, and an appropriate endpoint indicator, so it does not come as a shock that this is also one of the oldest quantitative analytical methods.
In the 18th century, Francois Antoine Henri Descroizilles1 invented the first buret. The process was developed further by Karl Friedrich Mohr, who, in 1855, wrote the first book about titration, called “Instructional Book of Titration Methods in Analytical Chemistry.”
Principles of Titration
In 18112, Amedeo Avogadro first suggested that at standard conditions, the number of molecules in a certain volume of gas always stays the same, no matter what type of molecules it contains. Later, in 1909, Jean Perrin defined the term “Avogadro constant” as precisely 32 grams of oxygen molecules, also known as a “mole” of oxygen3.
This definition explained that a defined amount of mass of a particular substance contains an exact number of molecules. Therefore, the number of molecules within a volume of solution is also defined. Leading from this, titration was born. It is seen to be as simple as counting the molecules of a substance (the analyte) in a sample matrix.
The volume of titrant is used to enable a chemical reaction with the analyte, and titration determines this. All chemical reactions occur in distinct stoichiometric ratios, and so the analyte concentration can be determined.
This is done by identifying the precise level of concentration of the titrant and calculating its consumption, or volume, using a measurable endpoint. Manual titration using a typical benchtop setup can be seen in Figure 1.
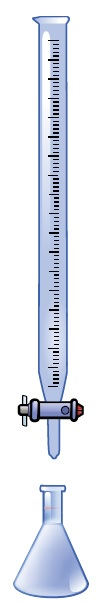
Figure 1. A common setup for a manual titration where the buret is filled with titrant, and the Erlenmeyer flask consists of the sample solution, which contains the analyte that needs to be measured.
The Ability of Titration Indicators to Determine pH
pH titrations are most common among several other variations of titration. The pH value at the endpoint may differ due to the acid dissociation constant (pKa) varying depending on each separate acid. A selection of pH indicators that cover most of the pH range from 0–14 is shown in Figure 2.
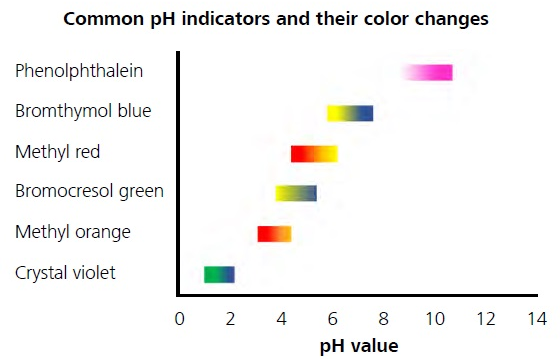
Figure 2. Color variations of different pH indicators depending on the pH value.
The color change of an appropriate endpoint can also be used to determine the endpoint of additional titration types, such as redox, complexometric, or argentometric titrations. Table 1 lists examples of the indicators used for these different reaction types.
Table 1. Endpoint indicators frequently used for different reaction types.
| Type of Titration |
Indicator |
| Complexometric |
Eriochrome black T Murexide |
| Argentometric |
Potassium dichromate
Ammonium iron(III) sulfate |
| Redox |
Change of color from titrant (e.g., potassium permanganate) Starch solution |
For each of these individual indicators, the color change is hard to predict accurately, particularly for the complexometric reactions. The color change depends on the pH value and the complex metal equally.
Manual Titration Challenges
Even though manual titration is almost 200 years old, it is still regularly used and cited in many standards and norms. However, manual titrations face some complications.
Visual Perception
The main reason for these challenges is the visual perception of the endpoint. Each individual experiences colors and color intensity differently, which results in deviations in the manual titration depending on the specific analyst performing the task and their bias. Figure 3 exemplifies this idea and the challenge in deciding upon an endpoint visually.
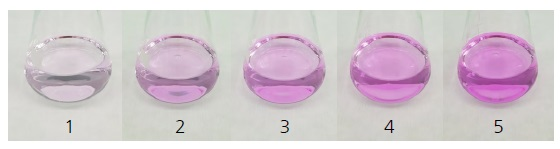
Figure 3. Titration of c(HCl) = 1 mol/L with c(NaOH) = 1 mol/L and phenolphthalein as the indicator. The individual images vary only when adding a single drop of the NaOH titrant.
The color intensities attained in 1-5 in Figure 3 vary only by roughly 50 µL NaOH titrant in each case. The question asked is where the “correct” endpoint should be selected. The accuracy of the measurement will suffer if this is not handled in exactly the same manner by each analyst.
Drop Size
The results of manual titration can only be as precise as the smallest drop size from the buret. One drop is defined to be 50 µL within the pharmaceutical industry, which means that a maximum precision regarding a 50 µL drop size can be attained. Assuming a consumption of about 5 mL titrant, this can lead to a 1% error or more.
Buret Error
As seen with regards to all glassware, the buret itself has a particular tolerance. A 50 mL buret is allowed a tolerance of 50 µL. However, other error sources can result from handling a buret, like the Parallax error. This error can happen if the user does not view the meniscus horizontally but from an angle. Meniscus readings vary depending on the angle of viewing, as illustrated in Figure 4.
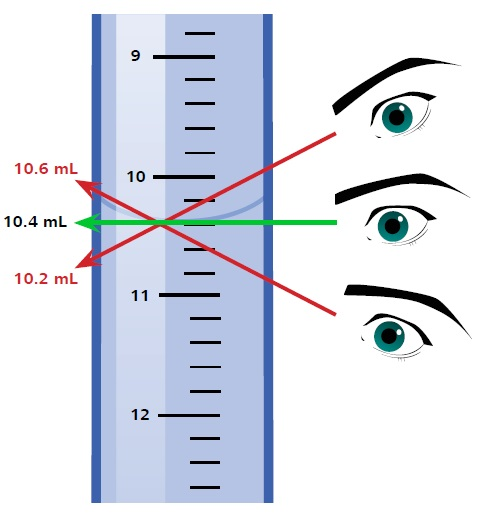
Figure 4. Meniscus readings vary depending on the angle of viewing, leading to Parallax error.
The points discussed demonstrate that although it is easy to perform manual titration, results are largely influenced by the user. Additionally, manual titration does not provide cost-effective benefits due to the extended length of time required for cleaning, refilling the buret, and manually calculating the results.
Moreover, there are safety concerns with regards to the lab personnel because chemicals can be spilled easily during the refilling of the buret. Data integrity is another consideration for manual titrations due to all data being manually transferred into a notebook or computer. Automatic calculations are not carried out, increasing issues linked to human error, a potential risk in this situation.
Development of Semi-Automated Titration
In order to solve the issues of inadequate accuracy and precision of manual titrations, an electronic buret can be used. It involves using a spindle that is motor-driven and a glass cylinder, which is filled with the titrant.
Recent generations of the equipment come with an added built-in stirrer and let the user complete automatic calculations and save the results on a storage device, like a USB stick or PC, or allow them to print the results immediately after analysis.
Accuracy of Semi-Automated Titration
When converting from manual procedures to semi-automated titration, the primary enhancements are with regards to the accuracy and precision. Electronic burets are able to dose as precisely as 2.5 µL for a 50 mL cylinder unit, which improves the accuracy by a factor of 20 in comparison to a manual titration.
However, a large drawback that persists is the subjectivity of visual perception. Subsequently, the next stage in titration evolution is automated potentiometric titration. In the mid-1960s, automated potentiometric titration was developed and overcame many of the remaining disadvantages associated with the process.
Data collection, equivalence point determination, and evaluation can be done automatically, which displays enormous benefits:
- Accuracy and precision improvements
- Less time used for dull manual processes
- Diminished human error potential
Better Accuracy and Precision
With modern auto-titrators, a resolution of 10,000–100,000 steps can be reached, corresponding to a precision of 5 µL decreased to 0.5 µL for a 50 mL motor-driven buret. The precision can be further improved by utilizing a motor-driven buret with a smaller volume.
Visual Perception Concerns Removed
Without the development of sensors, it wouldn’t be possible to establish automated titration. The first glass electrode for potentiometric titration was manufactured in 1909. Potentiometric sensors give an endpoint or equivalence point determination separate from color change or bias from a user.
As numerous samples need different electrode properties, there are now a large number of sensors that are accessible to be able to do this. Examples of the different types of titration are listed in Table 2.
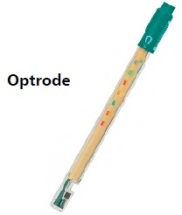
The Optrode is one sensor that must get a specific mention when investigating automating titrations. Titrations with color indications are still frequently used, so developments began to create the Optrode.
It is a sensor that can identify minute color differences by defining the change in absorbance at a particular wavelength. It then converts the absorption into a potential that can be measured. In such a way, colorimetric titrations also develop to be increasingly accurate and precise. The increased accuracy is because results no longer depend on the visual perception of laboratory users.
Traceable Results for Data Integrity
Manual titration methods involve all results being read from the buret and documented in the lab journal or typed manually into the software. This process poses error risk, with an increased likelihood of incorrect value transfer.
In order to solve the problem of incorrect value transfer, automated titrations document the measured values into a measuring point list, and automatic calculation of results is performed on the device. These results can be printed with the date and time displayed, or exported as a PDF file.
Less Sample Required
With manual titration, adequate accuracy and precision values require a large volume of samples to be used to gain a titrant consumption within a specific range and to resolve the error of the volume addition, which could be as high as 0.05 mL.
Table 2. Specific electrodes for a variety of applications.
| Sensor |
Application |
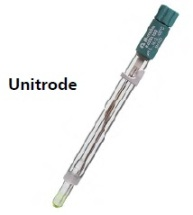 |
Universal laboratory use, pH 0–14 |
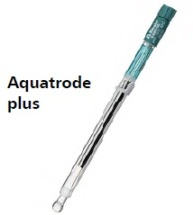 |
Water, general, pH 0–13 |
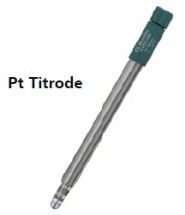 |
For redox titrations without any change in pH value |
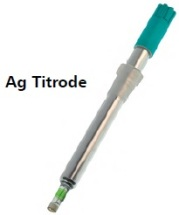 |
For argentometric titrations without any change in pH value |
 |
For titrations with indicators and a color change |
Conversely, the volume addition by a motor-driven buret might decrease to 0.5 µL, allowing the operator to lessen the sample size and to use a reduced amount of chemical reagents. It is suggested to utilize between 10–90% of the cylinder volume of the buret and to alter the sample size accordingly.
Cost-Effective Titrations
The highest cost of any manual titration is the cost of labor. Laboratory analysts need to be suitably trained and, during titration, are fully occupied. With automated titrations, on the other hand, this completely changes. The procedure on the autotitrator is programmed one time, and can then be recalled whenever needed by any member of personnel simply by pushing a button.
Manual and automatic analysis times required for a series of five titrations were compared. A summary of the results is shown in Table 3.
Table 3. Summary of five determinations of 10 mL c(NaOH) = 0.1 mol/L with c(HCl) = 0.1 mol/L. All titrations were completed with identical solutions and pipets.
| |
Automated titration |
Manual titration* |
| Mean value |
10.0023 mL |
9.92 mL |
| Standard dev. abs. |
0.009 mL |
0.04 mL |
| Standard dev. rel. |
0.09% |
0.4% |
| Total duration |
32 min 33 s |
14 min 53 s |
Duration with needed
presence of analyst |
1 min 33 s |
14 min 53 s |
* For manual titrations, phenolphthalein was used as the indicator.
This case displays that manual titration is quicker than the automated titration. However, the results are much less accurate. The mean analysis time per automated titration was measured at 6 min 12 s, meaning that during the series of five determinations, the presence of the lab personnel only accounted for about 1 min 33 s per analysis.
In comparison, during manual titration, the lab personnel is required throughout the whole titration, accounting for a significant amount of time saved.
Therefore, the time during each analysis can be used to either prepare the following sample or work on another system simultaneously. In this way, the throughput is enhanced, and the cost per analysis is reduced.
Summary
The benefits of automated titration over manual procedures are explained at length in many studies. As well as the significant enhancements in productivity, accuracy, and precision, the human influence on the analysis is lessened.
These points, in combination, lead to automated titration being easier to use compared to manual titration, in addition to results being more comparable and reproducible.
References and Further Reading
- Szabadváry, F. History of Analytical Chemistry, 1st edition; Belcher, R., Gordon, L. Eds.; Pergamon, 1966.
- Becker, P. History and progress in the accurate determination of the Avogadro constant. Rep. Prog. Phys. 2001, 64, 1945–2008.
- Achinstein, P. Evidence, Explanation, & Realism; Oxford University Press, 2010.
- Jander, G.; Jahr, K. F. Massanalyse, 15th edition; Schulze, G., Simon, J. Eds.; de Gruyter: Berlin, New York, 1989.

This information has been sourced, reviewed and adapted from materials provided by Metrohm AG.
For more information on this source, please visit Metrohm AG.