Carbon black rubbers (CBRs) are most frequently employed in automobile tires. The material introduces reliability and successfully conducts heat away from the tread which prolongs the tire life. Making sure that CBRs have the correct chemical composition is a crucial element in maximizing the performance of the tire.
CBRs have conventionally been challenging to measure by FTIR, as they lack transparency even when they have been cut very thin. Attenuated total reflectance (ATR) is a measurement method that has been shown to accurately measure these complex samples.
Attenuated Total Reflection
Diamond and Germanium
ATR has become the preferred technique for sampling materials using Fourier Transform Infrared Spectroscopy (FTIR). The key advantages of the device are that it is simple and easy to clean. ATR devices change the appearance of the spectrum in relation to what would be in transmission.
A thorough understanding of the tools and the differences when using them will greatly optimize the effectiveness of ATR in the laboratory. A magnifying glass works to concentrate the rays of the sun when the light transmitted between two different materials changes direction.
The direction change is found by each of the material’s index of refraction. A high index of refraction materials such as polycarbonate can be utilized in eyeglasses to produce thinner lenses than materials with a lower index such as glass, as the polycarbonate is able to redirect the light more successfully.
To comprehend ATR, imagine a fish aquarium with a rectangular shape. The far window is transparent when looking straight through but the side windows appear as mirrors, which is a phenomenon caused by internal reflection. If a finger is placed on the side glass, the edges of the fingerprint can be seen, but not the gaps in between.
Put simply, at this angle, the light exits the side window very slightly, and this “evanescent wave” interacts with the finger ridges allowing them to be visible to your eye. The depth of penetration, how far the light moves out of the glass, is too shallow for the fingerprint valleys to be visible.
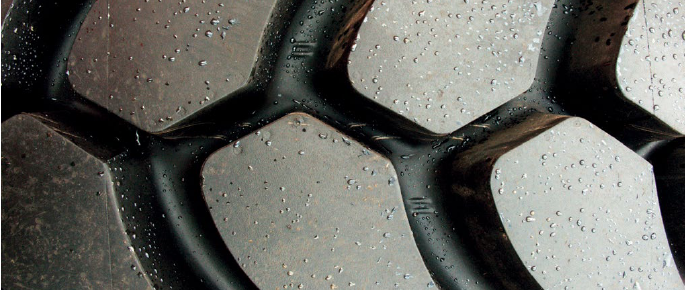
Figure 1. Carbon black rubbers, such as this tire, represent a challenging sample for infrared analysis.
The same basic principles are true for infrared spectroscopy. With correct alignment, IR light can be controlled to slightly emerge from an infrared transmissive crystal. This will come in contact with any sample in close proximity to the crystal, like the fingerprint seen on the aquarium’s side window.
The majority of ATR accessories are supplied with pressure towers to push the sample against the crystal. The infrared light comes into contact with the sample at the surface of the crystal, which generates the spectrum. The spectrum is reliant on the depth of penetration dp which in turn, relies upon multiple factors. Mathematically, this is expressed by
dp = λ / {2 π nc [sin2θ – (ns/nc)]1/2}
where λ is the wavelength of the light, θ is the angle at which the light interacts with the crystal’s surface, and nc and ns are the index of refractions of the crystal and sample, respectively.
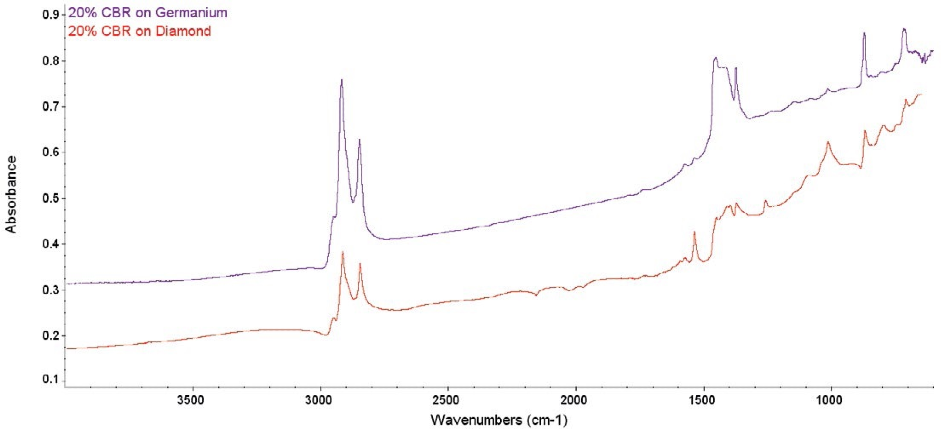
Figure 2. Comparative raw spectra from 20% CBR. The diamond ATR spectrum shows several problems, while the Ge ATR spectrum is clean.
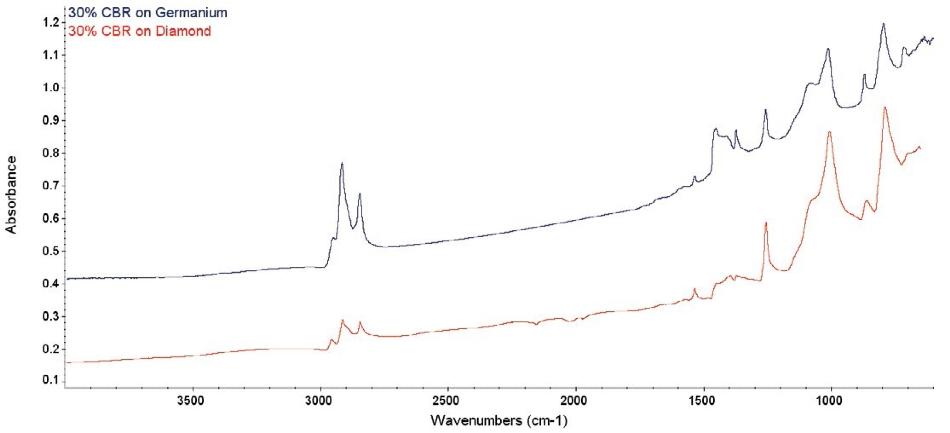
Figure 3. Comparative raw spectra from 30% CBR. Again, there are artifacts in the diamond ATR spectrum, but not in the Ge ATR.
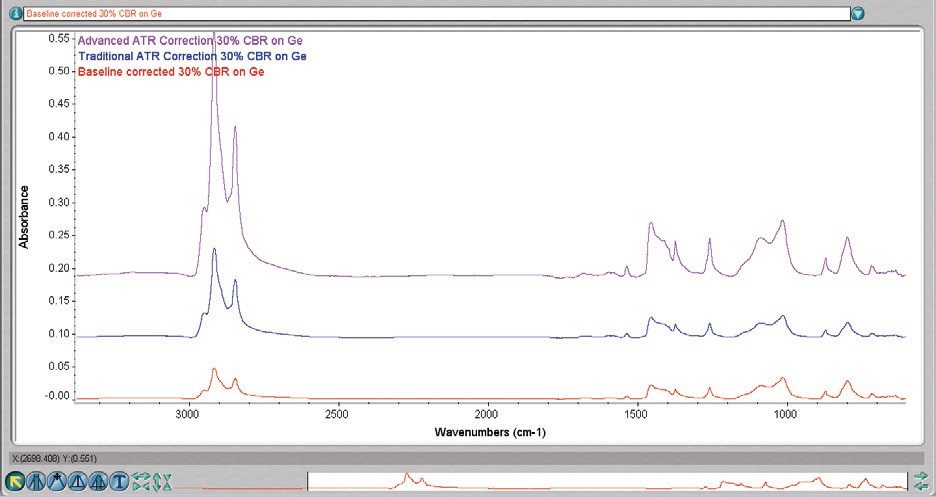
Figure 4. 30% CBR on Ge. The bottom spectrum is baseline-corrected only, the middle has the traditional ATR correction applied, and the top has the Advanced ATR Correction applied. Common scaled, offset for clarity.
Two widespread ATR crystals are germanium (Ge) and diamond. Diamond is very sturdy, being both chemically inert and hard.
For diamond, dp is more than 2 microns at 1000 cm-1. Ge is similarly hard and chemically inactive, but to a lesser extent than diamond. The main variation lies in the dp, which is roughly 0.7 microns at 1000 cm-1, because of the significantly higher index of refraction for Ge.
It is the lower depth of penetration for Ge that makes it the most suitable for carbon black rubbers. CBRs have a high refractive index, similar to that of the diamond.
In the equation described earlier, if the index of the sample is too similar to the crystal’s index, the square root term is negative, the ratio of indices is nearly 1, and little to no ATR effect takes place.
Advanced ATR Correction, which takes all the variables into account, for the first time allows the use of transmission databases for comparison to ATR spectra.1
The key difference between older ATR corrections and the advanced correction is the understanding that the index of refraction in a sample changes (increases) when close to an absorption peak. Figures 2 and 3 show the effect of this.
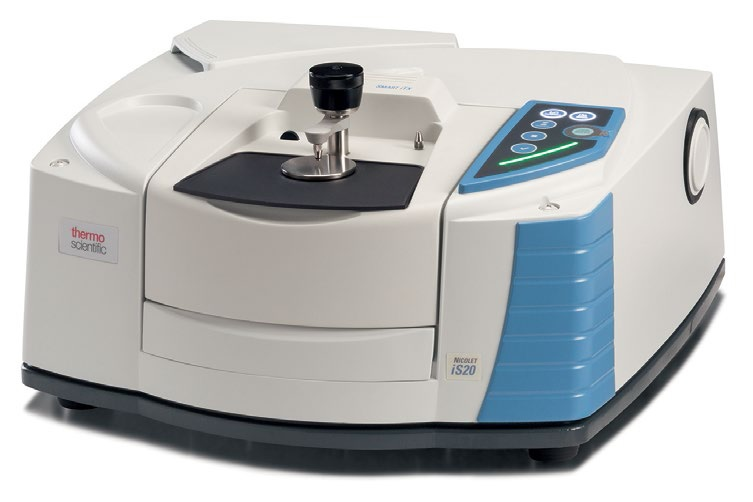
These spectra were gathered through an FTIR spectrometer such as the Thermo Scientific™ Nicolet™ iS20 FTIR Spectrometer. A germanium and diamond ATR accessory was additionally used.
The sample index is meeting or exceeding the crystal’s index and there is an instant change in dp close to the strong absorption bands around 1400 cm-1.
The spectra is negatively distorted by this and they cannot be simply corrected. In comparison, the Ge spectra in both figures display well-defined and clean peaks. This is caused by the much higher refractive index for Ge and the shallow depth of penetration.
The strong diamond absorption bands in the middle of the spectrum also do not effectively ratio. The diamond bands ratio out correctly when the path of light through the crystal is equivalent in the sample spectra and the background.
The close match of the index of refraction between the CBR and the crystal caused the light path to alter, and the diamond bands to ratio incorrectly. The result of this can be observed in the spectral artifacts shown around 2000 cm-1 in the diamond spectra. The spectrum for Ge is again completely clean.
The entire investigation of the CBR is performed using the effective Thermo Scientific™ OMNIC™ Specta™ Software. The spectrum is the first baseline corrected and processed.
Figure 4 displays the (baseline corrected) spectrum prior to ATR correction, with the ATR correction available from the majority of suppliers, and with Thermo Scientific™ Advanced ATR Correction.
The variation in the latter is more significant than just in the application of an intensity correction. Bands, where strong absorbance changes the index of refraction, are corrected by the algorithm. The spectrum, now having been corrected, can be searched in reference to normal transmission libraries.
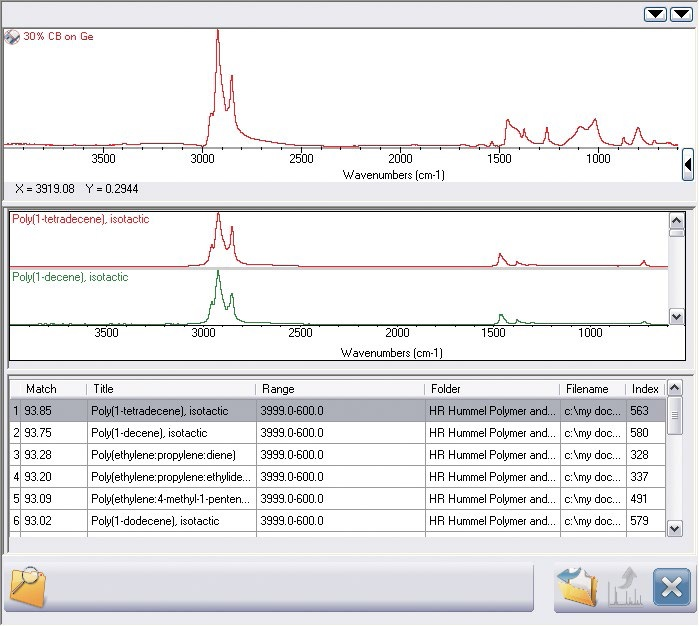
Figure 5. Simple search result for the top spectrum in Figure 4. The result is good, but there are extra peaks visible not in the result.
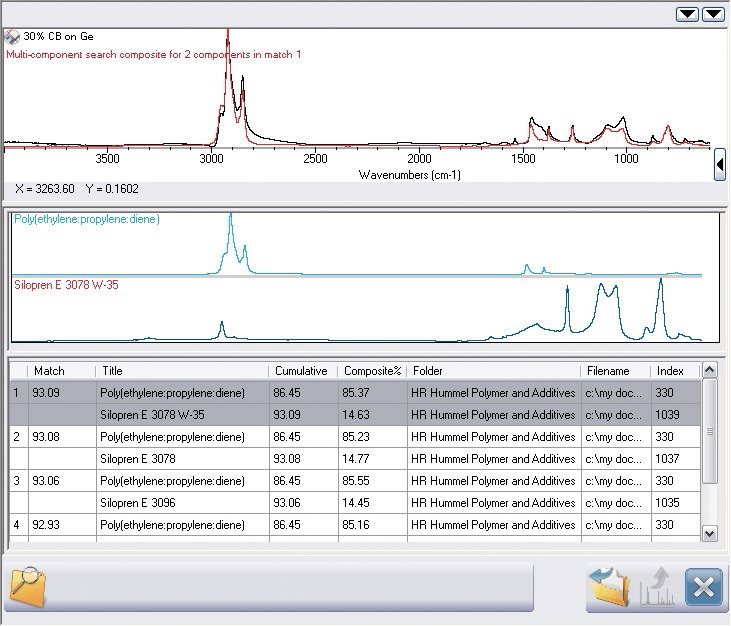
Figure 6. Multi-component search result from OMNIC Specta. The search result is now complete and agrees remarkably well with the spectrum.
A simple search provides the results shown in Figure 5. There is a strong match because a high match index is recorded and the base polymer has been located.
Visual analysis shows that multiple peaks close to 1000 cm-1 are not included in the search result as a second element is present. OMNIC Specta’s exclusive multi-component search algorithm fills the gap in the analysis as demonstrated in Figure 6.
The successful algorithm acquires two components from this CBR, the silane slip aid and the base polymer (notably, equivalent to the simple search).2
The sample which is a car door insulation strip utilizes a silane coating to stop the adhesion of the window to the insulation. The composite spectrum is visually exceptional as it shows a near-perfect similarity to the initial spectrum.
Conclusion
Carbon black rubbers are a complex IR sample. Diamond is not a wide-ranging solution for CBRs as the bands evaluated are distorted.
Clean peaks are offered by Ge. Thermo Scientific then supplies all the necessary tools to perform the analysis, including OMNIC Specta’s multi-component search and Advanced ATR Correction. The software and hardware work in synergy to create an effective tool for analysis.
References and Further Reading
1. Thermo Scientific Application Note AN01153
2. Thermo Scientific Technical Note TN51506
*Experiment can be performed using the Thermo Scientific™ Nicolet™ iS5, iS10 or iS50 FTIR Spectrometer systems.

This information has been sourced, reviewed and adapted from materials provided by Thermo Fisher Scientific – Materials & Structural Analysis.
For more information on this source, please visit Thermo Fisher Scientific – Materials & Structural Analysis.