Elemental Composition
Simplifying Chemical Composition and Impurity Analysis
Final battery performance can be greatly affected by deviations in chemical composition or impurities in electrode materials. Due to this, chemical composition and elemental impurity analysis are an essential stage of the battery manufacturing process.
However, the frequently-used inductively coupled plasma (ICP) analysis is not always the optimal tool for this. ICP is inefficient and costly for most elemental analysis needs because it requires sample digestion and frequent calibration.
For a simpler method to analyze elemental composition and detect impurities down to ppm level, Malvern Panalytical provides X-ray fluorescence (XRF) solutions that do not need sample digestion or frequent calibration and are up to three times cheaper in terms of per sample analysis. Specifically, chemical composition analysis of cathode materials at low-percentage elemental levels has increased reliability when measured with X-ray fluorescence.
Malvern Panalytical’s Epsilon 4 benchtop energy dispersive XRF spectrometer can accurately measure elemental composition in approximately a few minutes. If better light element sensitivity is needed, the Zetium wavelength dispersive XRF spectrometer is recommended. These solutions can help manufacturers improve costs and use of human resources, while saving ICP for extremely low-level impurity detection.
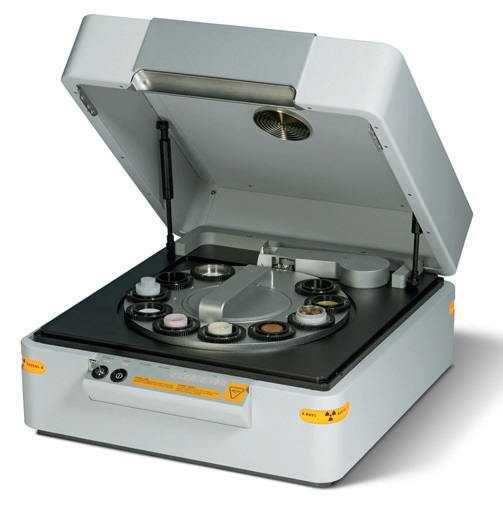
Image Credit: Malvern Panalytical
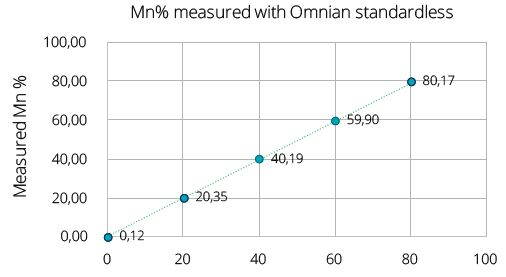
Figure 1. Composition and impurities analysis on five samples of LiFexMn1-xPO4 measured on the Epsilon 4 is shown in the table below. Measured Mn composition (Figure 1) shows a straight-line calibration with Target Mn composition in these samples. Image Credit: Malvern Panalytical
Table. Typical elemental composition analysis on a LFMP cathode material using XRF. Source: Malvern Panalytical
| Sample |
Target Material |
Measured composition and impurities |
| |
|
Mn % |
Zr |
Al |
Ca |
Cl |
Co |
Cr |
Cu |
Ni |
S |
Si |
Ti |
Y |
Zn |
| SMP1 |
LiFe02Mn08PO4 |
80.2 |
0.11 |
0.011 |
0.014 |
0 |
0 |
0.017 |
0 |
0.026 |
0.008 |
0.022 |
0.009 |
0.006 |
0 |
| SMP2 |
LiFe04Mn06PO4 |
59.9 |
0.19 |
0.012 |
0 |
0 |
0.001 |
0.024 |
0.018 |
0.013 |
0.004 |
0.02 |
0.01 |
0.009 |
0.006 |
| SMP3 |
LiFe06Mn04PO4 |
40.2 |
0.117 |
0.041 |
0 |
0 |
0.003 |
0.034 |
0.011 |
0.023 |
0.006 |
0.024 |
0 |
0.007 |
0.005 |
| SMP4 |
LiFe08Mn02PO4 |
20.4 |
0.161 |
0.008 |
0.014 |
0.037 |
0 |
0.042 |
0.009 |
0.015 |
0 |
0.02 |
0 |
0.006 |
0.006 |
| SMP5 |
LiFePO4 |
0.1 |
0.155 |
0.015 |
0 |
0 |
0 |
0.055 |
0.009 |
0.024 |
0.007 |
0.024 |
0 |
0.009 |
0.004 |

Image Credit: Malvern Panalytical
XRF Sample Preparation
Sample preparation is a key cause of error in elemental composition analysis. Frequently, preparation techniques like pressed pellets (in XRF) or acid digestion (in ICP) are affected by mineralogical or particle size effects in metal samples, negatively affecting the result accuracy.
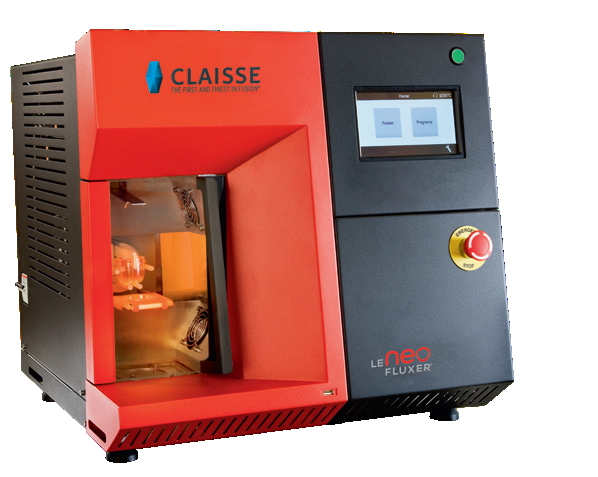
Image Credit: Malvern Panalytical
To achieve reliable sample preparation for XRF or ICP, Malvern Panalytical provides a high-performance fusion solution. Fusion consists of dissolving a fully oxidized sample at high temperature in an appropriate solvent (a flux) in a platinum, zirconium or graphite crucible. The melted combination is agitated and poured into a mold to form a glass disk for XRF analysis. It is also for it to be poured into a beaker to form a solution for Atomic Absorption Spectroscopy (AAS) or ICP analysis.
Malvern Panalytical has over 40 years of expertise in designing and delivering fusion recipes for numerous types of complex samples and they currently offer two fusion instruments. The LeNeo instrument is robust and perfect for battery sample fusion. It is an automatic electric instrument that can prepare glass disks for XRF analysis, in addition to borate and peroxide solutions for AA and ICP analysis.
With one fusion position, it offers increased ease of use, operator safety, and superior analytical performance in the laboratory. This eliminates doubt and drives high-precision quality control. To achieve high sample throughput, the TheOx advanced instrument can be used and has six fusion positions.
Crystalline Phase Composition
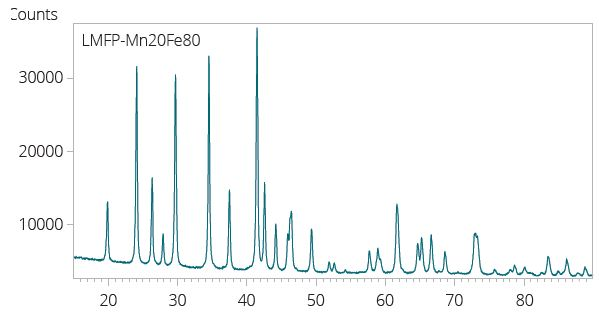
Typical XRD pattern of a Lithium Manganese Iron Phosphate (LFMP) cathode material. Image Credit: Malvern Panalytical
Crystalline phase is an essential aspect of battery electrode materials, governing lithium-ion transport at atomic level. X-ray diffraction (XRD) is frequently used to analyze crystalline phase composition and quality in synthesized powder materials.
In battery cathode materials, it is possible to use XRD to guarantee that reactants have totally fused to the chosen and stable crystalline phases during the calcination process.
Additionally, it can be utilized to measure chemical composition or to make estimates about primary particle size (from the measurement of crystallite size), which plays a vital role in ion migration. In anode materials, XRD can measure the degree of graphitization in synthetic graphite, which greatly affects anode energy density.
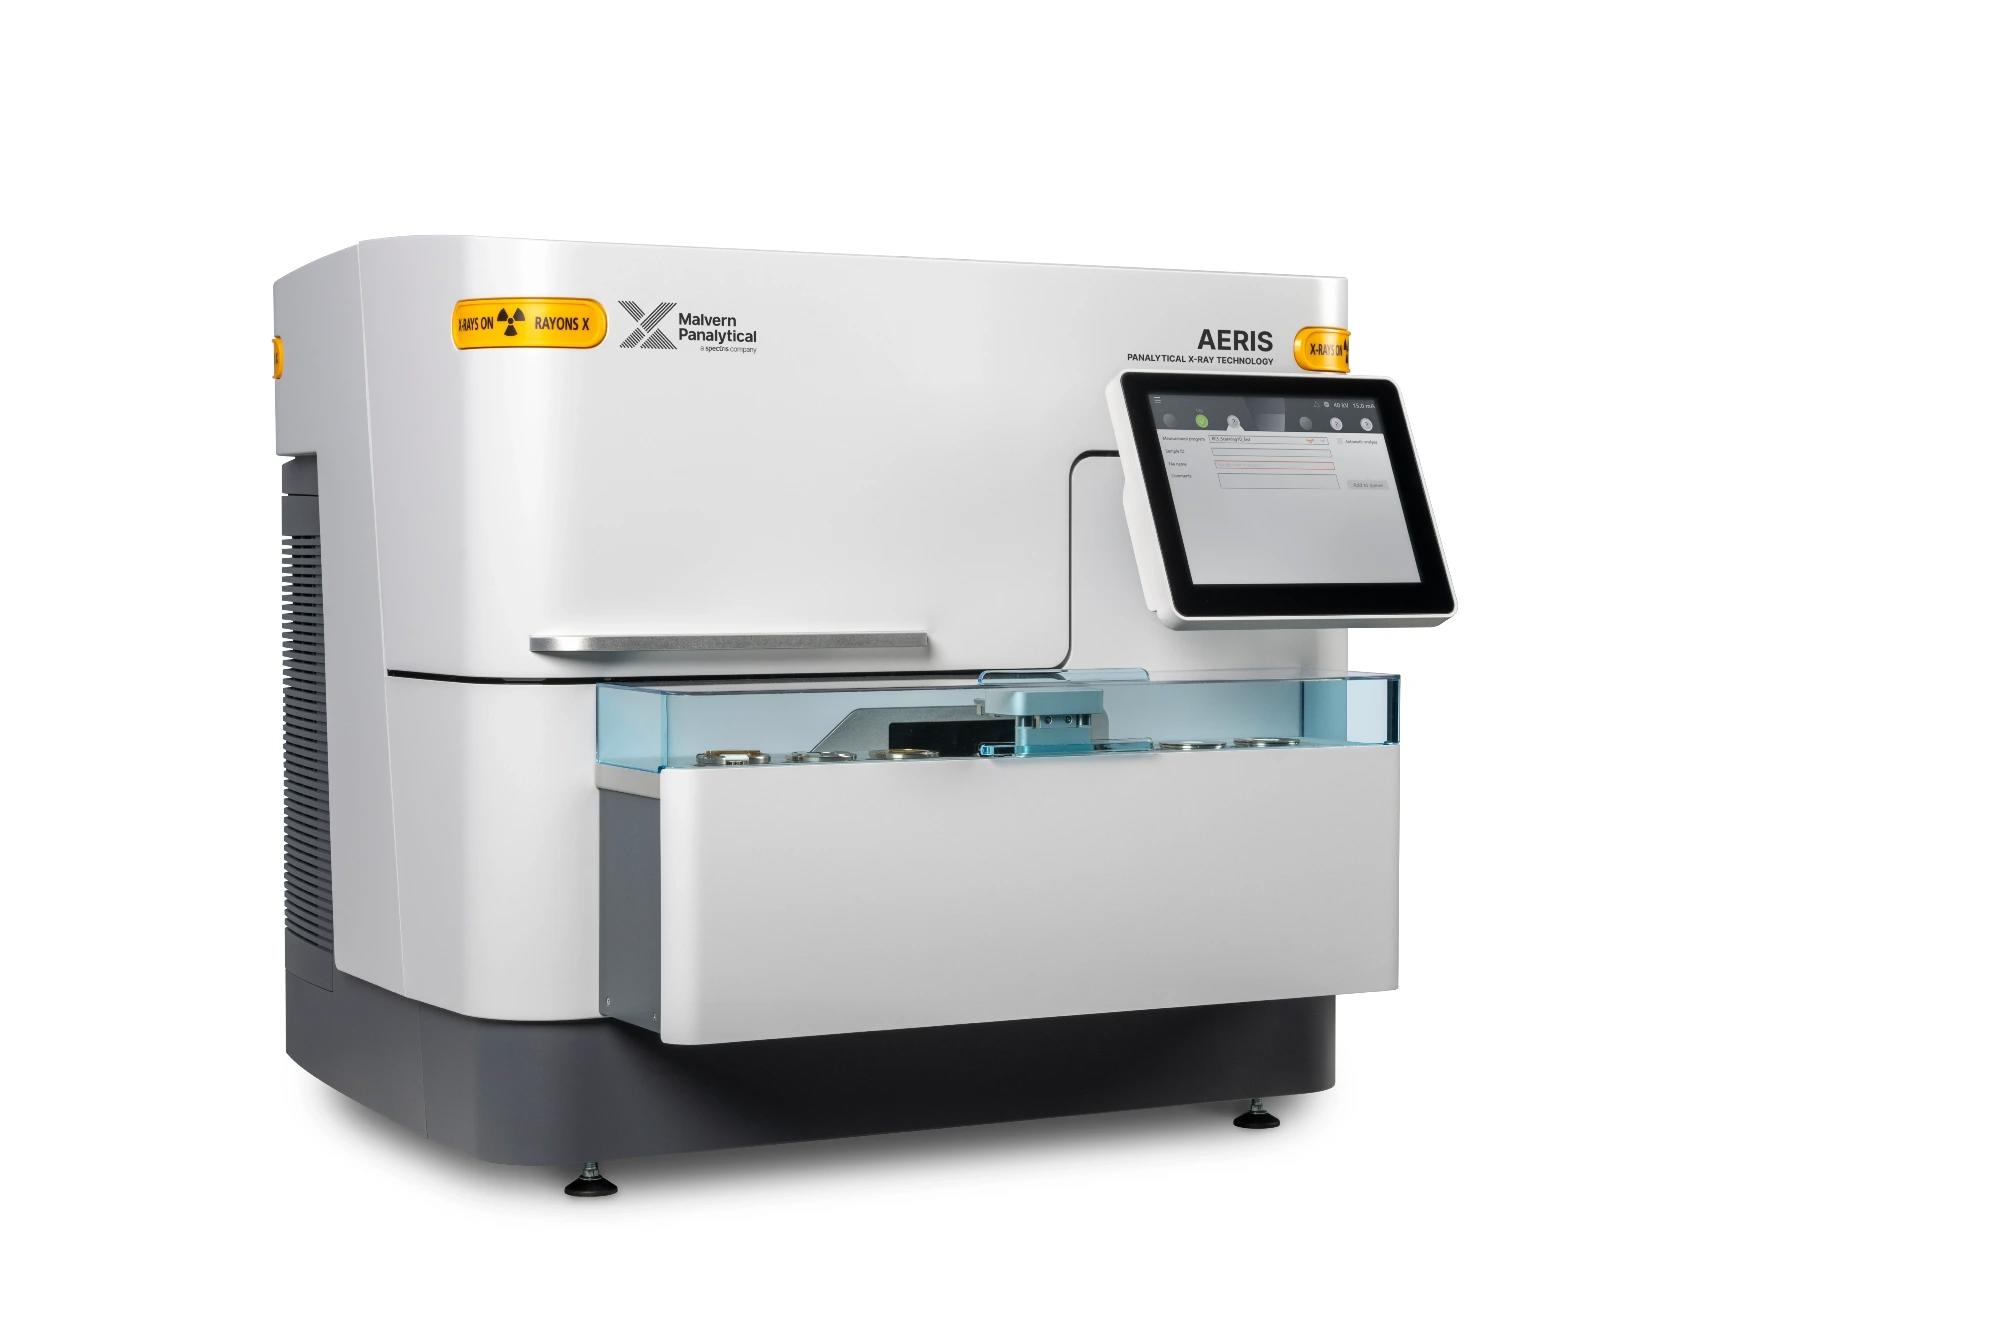
Image Credit: Malvern Panalytical
The Aeris compact X-ray diffractometer can be used to carry out these applications easily. Its automated analysis means that sample measurement on Aeris does not need any prior XRD expertise. Also, the Aeris is built for industrial automation. It meets requirements for industrial high throughput sampling, since typical sample measurement is complete in just a few minutes. Samples can be fed either manually or by a belt automation.
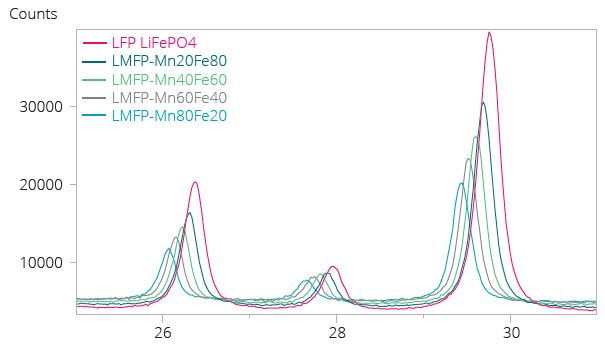
Figure 2. Example LMFP Cathode Material: Section of XRD pattern (Figure 2) showing peak shift to lower angles as the Mn content increases, meaning lattice expansion along c-axis. Image Credit: Malvern Panalytical
Zeta Potential Analysis
In the production of electrode slurry, zeta potential (related to charge on particle) plays a key role in slurry stability. Low zeta potential can lead to agglomeration and aggregation of particles resulting in unstable particle dispersion in slurries and, in turn, compromising battery quality. The ability to accurately monitor and optimize zeta potential is useful and also essential to battery manufacturers.

High zeta potential = stable dispersion. Image Credit: Malvern Panalytical

Low zeta potential = unstable dispersion / agglomeration. Image Credit: Malvern Panalytical
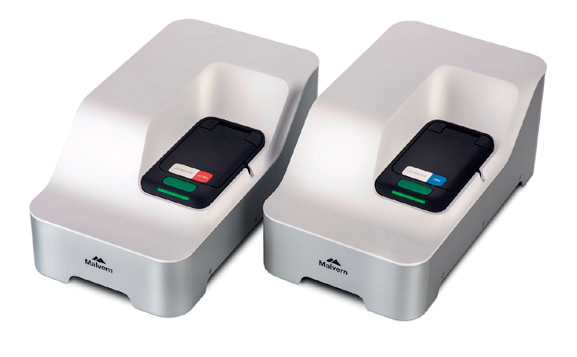
Image Credit: Malvern Panalytical
To meet this requirement, Malvern Panalytical has created the Zetasizer. This tool measures zeta potential with outstanding accuracy, repeatability, and consistency. It can improve understanding of agglomeration and sedimentation in precursor slurry, it ensures electrode slurry stability, and it provides a better understanding of slurry wetting behavior on flat surfaces. Its specialized cell and constant current mode allows manufacturers to optimize Ph and concentration for stable slurries to manufacture high quality electrodes, especially for high-concentration and highly conducting samples.
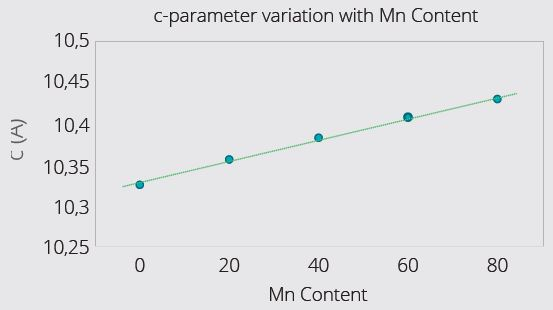
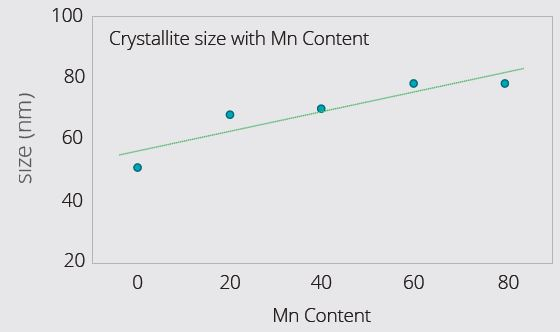
Figure 3 (Top) and Figure 4 (Bottom). Example LMFP Cathode Materials with varying Mn content: Lattice expansion along c-axis (Figure 3) with increasing Mn content. For unknown batch samples, c-parameter can be measured, and composition deduced using calibration graph (Figure 3). XRD also reveals that crystallite size increases with Mn content (Figure 4) – higher Mn facilitates larger crystallite size. Crystallite size usually has a close relationship to the primary particle size. Image Credit: Malvern Panalytical
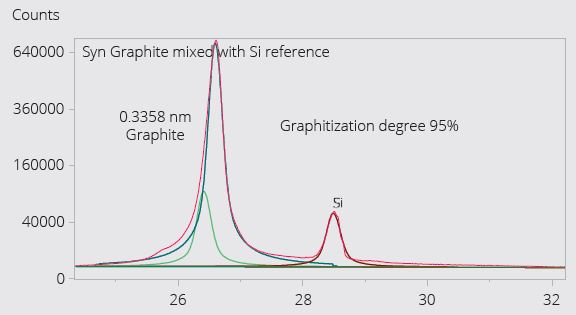
Figure 4. Example Synthetic graphite: Degree of graphitization and orientation index are important attributes of synthetic graphite, which is a commonly used anode material due to its superior consistency and purity compared to natural graphite. Aeris can measure both the graphitization degree and orientation index. Figure 4 shows the measurement of the degree of graphitization in one such material. Image Credit: Malvern Panalytical

This information has been sourced, reviewed and adapted from materials provided by Malvern Panalytical.
For more information on this source, please visit Malvern Panalytical.