Within this article, the K-Alpha™ X-ray Photoelectron Spectrometer (XPS) System from Thermo Scientific™ is used to measure and then map the work function of a damaged solar cell structure.
Part of the structure was delaminated, and three clearly defined, visible areas existed, with each area possessing a different work function. It is possible to correlate features on the work function maps with the chemical composition of the surface.
Thermo Scientific K-Alpha XPS.
Introduction
Within a wide range of materials technology areas, it is essential that both the chemical composition and the electrical properties of the material are effectively controlled. A good example of this requirement is the manufacture of solar cells, where, in this case, the solar cell is based on a thin film of CIGS (Cu (In, Ga) Se2).
The device’s structure also includes an upper electrode which contains indium tin oxide (ITO), cadmium sulphide and zinc oxide. The full structure is kept separate from a steel substrate by layers of chromium and molybdenum.
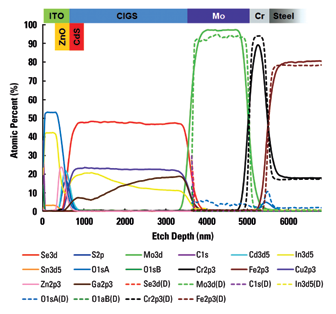
Figure 1. Depth profile through CIGS device.
The solid lines shown in Figure 1 represent the profile acquired from the CIGS device. The dashed lines in this Figure illustrate the profile from an area of the device which is damaged. This profile is consistent with the damage resulting from delamination of the device.
Experiment
Work functions may be measured using a photoelectron spectrometer in the following manner.
A spectrum is obtained from the whole spectral range. This allows cut-off energy to be measured at both low and high binding energy. It is generally necessary to bias the sample in order to avoid effects which are a result of the instrument’s work function.
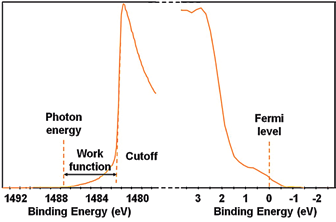
Figure 2. Part of the survey spectrum from gold acquired using monochromatic Al Kα radiation.
Figure 2 displays the two extreme ends of a survey spectrum obtained from gold with a monochromated source of X-rays (Al Kα, photon energy 1486.6 eV). The complete spectrum is shifted so that the Fermi level is aligned with 0 eV binding energy.
Next, the high binding energy cut-off is measured and subtracted from the known photon energy amount (Figure 2) before the work function is provided by the difference between the cut-off energy and the photon energy. In this instance, a value of 5.1 eV was calculated, and this figure was in good agreement with clean gold’s photoelectric work function.
This approach very much relies on the spectrometer being precisely calibrated and the photon energy being correctly known. The K-Alpha instrument possesses internal standard samples (copper, silver and gold) which the instrument can use to automatically calibrate the XPS binding energy scale.
Photon energy can be verified by measuring the position of an X-ray induced Auger peak on the binding energy scale, then adding it to the known kinetic energy for the specific peak in the Auger spectrum. The K-Alpha does this automatically during the calibration process by using the copper sample built into the instrument.
Results
Figure 3 displays the live optical view of the damaged solar cell at the K-Alpha’s analysis position. XPS analysis at three positions (Figure 3) confirmed that the area labelled ‘ITO’ is fundamentally undamaged indium tin oxide.
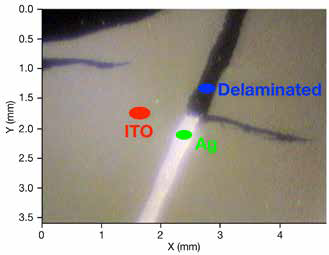
Figure 3. Optical view of damaged solar cell tions indicated in device at the analysis position of K-Alpha.
The area labelled ‘Ag’ is primarily silver being used as an electrical contact to the device. The third area is made up of molybdenum with some remains of the CIGS material. Again, this shows consistency with the damage resulting from delamination of the device.
Because of this, it is possible to map an area which incorporates the three materials, enabling the construction of a work function map. This form of map is displayed in Figure 5, and this was collected with an X-ray spot size of 50 µm.
The work function map clearly shows the three regions of the sample. The maps were constructed using advanced PCA (Principal Component Analysis) algorithms within the Thermo Scientific Avantage software, which comes as standard with the K-Alpha.
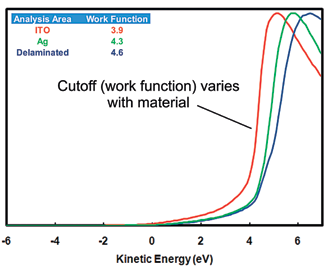
Figure 4. The cut-off region of the XPS spectrum from each of the three areas of the sample.
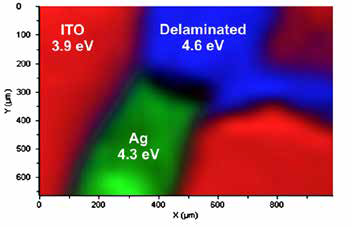
Figure 5. A work function map of the sample using a 50 μm X-ray spot from the K-Alpha work function values are shown on the image.
Summary
As can be seen via the examples above, work function can be measured quickly and precisely with the K-Alpha. Furthermore, it is possible to map the work function over a sample’s surface when PCA is applied to the spectra.
Acknowledgments
Produced from materials originally authored by Paul Mack, Tim Nunney, and John Wolstenholme from Thermo Fisher Scientific.

This information has been sourced, reviewed and adapted from materials provided by Thermo Fisher Scientific – X-Ray Photoelectron Spectroscopy (XPS).
For more information on this source, please visit Thermo Fisher Scientific – X-Ray Photoelectron Spectroscopy (XPS).