
Image Credit: TOFWERK
The Vocus PTR-TOF is a robust, low-power, mobile instrument capable of measuring volatile organic compounds (VOCs) in the air in real time, which allows environmental and industrial problems not typically accessible by traditional mass spectrometry to be addressed. This article details the patterns of VOC emissions from a Vocus PTR-TOF S mobile laboratory around a Chinese megacity, including near a petrochemical facility.
Characterization of VOC Emissions in Urban Areas
Volatile organic compounds are rich in the air of dense, urban and industrial areas. While people live and work in these areas, certain VOCs called “air toxics” that include single-ring aromatics, can have negative effects on human health. Additionally, complaints can be made by nearby residents because of odors.
Tight regulations control the compounds that add to ozone and fine particulate formation through photochemical reactions. High levels of VOCs can stem from point sources in both industrial sites or residential areas, as well as from non-point anthropogenic activities in populated areas.
Industrial operators may be better able to tighten their manufacturing systems and reduce waste by discovering and locating the sources of VOCs, as they act as an indicator of leaks and inefficiency in equipment and infrastructure. Operators may also be able to comply to regulations by locating VOCs in working environments, too.
These issues are particularly important in eastern China when the high density and close proximity of industrial zones to residential areas are taken into account. For example, the air quality in Shanghai city is regularly heavily affected by the activity in its suburban industrial areas and the transportation of pollutants from cities nearby.
Proton-transfer-reaction time-of-flight mass spectrometry (PTR-TOF) is an analytical technique uniquely situated to mobile monitoring and point-source chemical fingerprinting. The Vocus PTR-TOF is an instrument platform capable of directly measuring ambient air at a rate of several measurements per second, which provides a near real-time measurement of the VOC content of a given environment. A high-resolution time-of-flight mass analyzer facilitates the simultaneous measurement of tens to thousands of VOC species, which are made identifiable by their exact mass-to-charge ratios.
In this study, a Vocus S PTR-TOF operating in H3O+ mode was mobilized in a van that was 3.8 meters high. A 1/8′ sampling line drew ambient air ~0.5 meters above the top of the van at a flow rate of ~2 L/min. The length of the sampling line was approximately 3 meters in front of the Vocus PTR instrument inlet. Before and after daily drives, zero air and calibration measurements were carried out. The acquisition rate of the instrument was set to 1 second and the mass range was set to 1-500 Th.
Detection of VOC Hotspots and Point Sources
The mobile Vocus S was driven in a search pattern in Shanghai during a large multi-institution campaign. The drive path passed through urban, rural, and industrial areas. Figure 1 illustrates the hotspots detected for particular VOCs in an area spanning 57.000 km2. To explore aromatic VOCs in Shanghai using Google Earth or LocaSpace Viewer, download data set (.kmz).
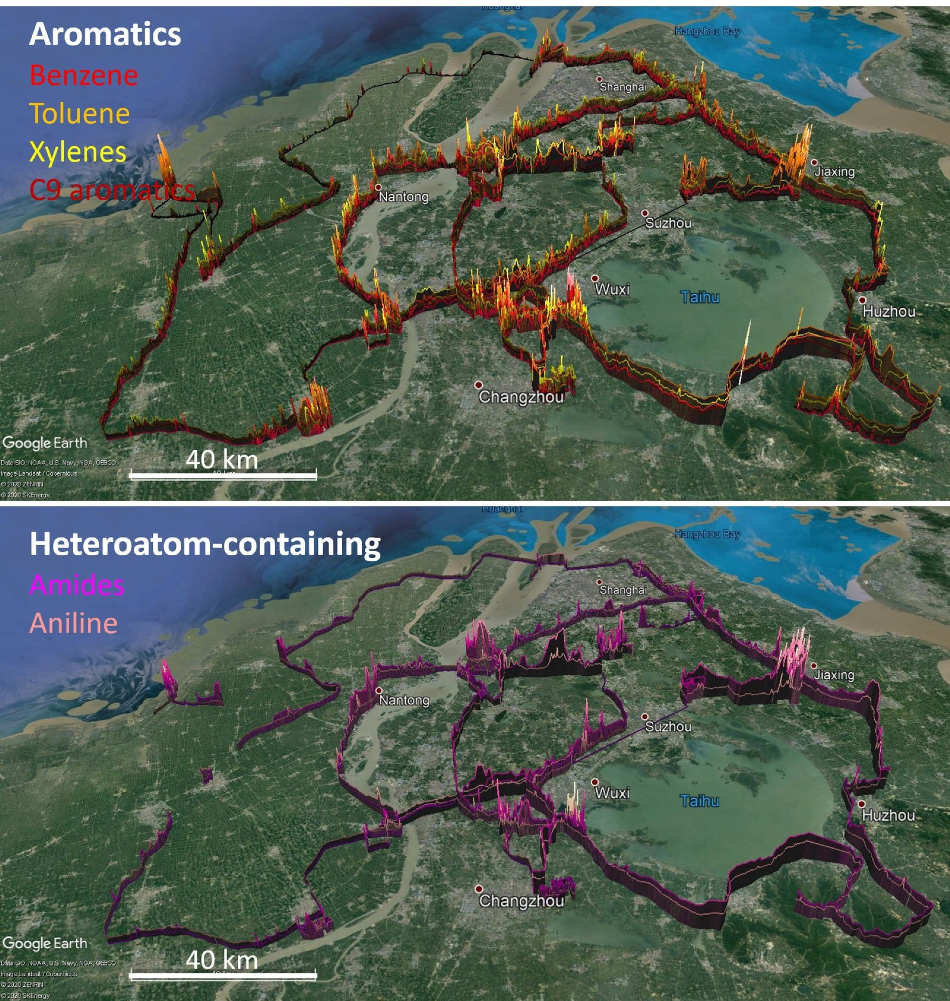
Figure 1. Concentrations of selected VOCs above baseline detected in Shanghai. Different VOC are indicated by color. The scale is logarithmic, from 100 ppt to 1.6 ppm; the height and color intensity indicate the mixing ratio. Points with mixing ratio less than 100 ppt are not shown. Image Credit: TOFWERK
It is also possible to use mobile PTR-TOF to target point sources in a much smaller area. A petrochemical plant in Eastern China served as another search pattern through which the Vocus S was driven. In this search pattern, hundreds of VOCs were detected, found in mixing ratios that ranged from a few parts-per-trillion (ppt) to more than a part-per-million (ppm) (Figure 2 A).
Figure 2A only shows a subset of the detected VOCs, showing that a large, dynamic range and simultaneous acquisition of a large number of VOC masses is necessary. A number of isobaric masses are shown in Figure 2A, which can only be measured separately if an instrument with high mass resolving power is used.
It was also discovered that the composition of the VOC mixture varied significantly from point to point. A correlation analysis of VOCs determined the top ten sources of VOC mixtures present at the facility. The data from this analysis was then used to quantify the contribution of each source to the total amount of VOC present in the facility (Figure 2). The VOCs included in Figure 2A were used for the source apportionment analysis. These particular VOCs were selected due to the fact that their signal-to-noise ratio is higher than 2.
It is important to include even VOCs with smaller mixing ratios in source apportionment analyses. This is because they may offer necessary distinctions between the chemical fingerprints of two sources.
The top ten sources of mixed VOCs make up approximately 92 percent of the total VOC emissions that were detected at the site. The remaining emissions detected were found to be almost entirely pure benzene. The various sources found were related to refinement and storage equipment situated in different areas of the facility. It was possible to determine the location of each VOC source by plotting the measured VOCs on a map (Figure 3). Overall, the characterization of this particular site using a mobile laboratory took less than an hour.
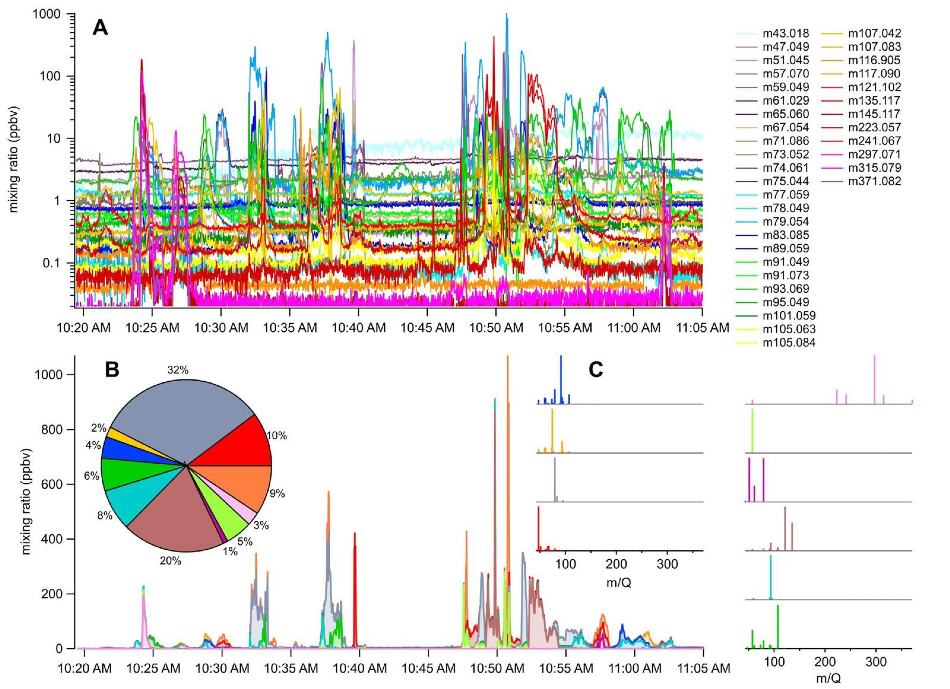
Figure 2. A. An overwhelming variety of VOCs observed at the petrochemical industrial park, with concentrations ranging from 10 ppt to 1000 ppb. B. Factor analysis of the observed VOCs reveals a smaller number of sources, each with a distinct VOC composition. The pie chart shows the contribution of each source to total VOC. C. Mass spectra of the sources containing mixed VOCs. Image Credit: TOFWERK
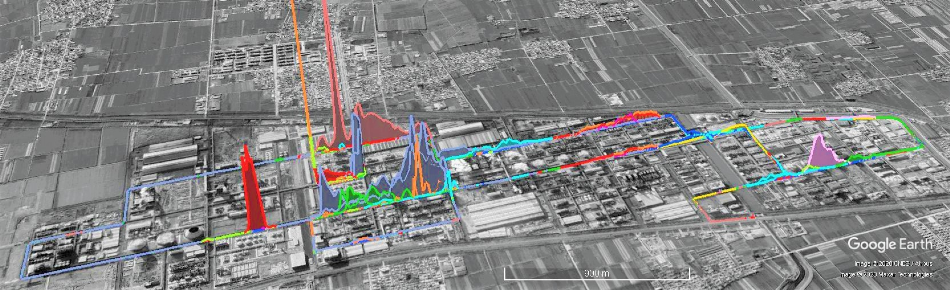
Figure 3. Locations of compositionally-distinct VOC plumes at the petrochemical facility. Image Credit: TOFWERK
Acknowledgments
Produced from materials originally authored by Wen Tan, Abigail Koss, Liang Zhu from TOFWERK.

This information has been sourced, reviewed and adapted from materials provided by TOFWERK.
For more information on this source, please visit TOFWERK.