Milk powder, as a result of milk processing, is a key product and it is widely used in the manufacture of ice cream, chocolate, confectionery, cultured milks and yogurts, bakery products, soups, and sauces.
As global living standards continue to improve, the consumption of dairy products progressively increases as well as the demands placed on them, including flavor profiles and sensory characteristics.
It is already known that the composition and physical and sensory properties of milk powder are impacted by production, packaging, storage, transportation and other processes.
For instance, it is believed that various manufacturing specifications in the production process of milk powder, such as homogenization, spray drying and sieving, enhance the flavor and taste of milk powder: proper homogenization is necessary to break up large fat particles throughout the production process.
However, a balance must be struck in order to achieve a good product in the homogenization process.
On the one hand, a considerable amount of fat particles will bind with the outer layers of protein particles, forming larger aggregates. If there is insufficient homogenization of fat particles, then the milk powder’s stability and ability to flow will be limited.
Conversely, excessive homogenization leads to a significant increase in the specific surface area of fat particles, which will result in the flocculation of milk powder or acceleration of the fat oxidation, thus diminishing the flavor and stability of the product.
Therefore, consistent monitoring of the size change of milk powder particles is a crucial part of the production process.
Particle Sizing of Milk Powder
The particle size distribution of milk powder has a considerable influence on the quality of the product as well as how it is packaged, stored and used in its final application.
It is of key importance for milk powder manufacturers and relevant equipment manufacturers to frequently inspect the size distribution of milk powder throughout the production process. General milk powder sizing methods include microscopy, image analysis, sieving and light scattering.
Milk powder manufacturers utilize laser diffraction extensively across their production processes due to it being easy to use and having the benefits of high accuracy and precision.
In this note, the Bettersizer 2600 laser diffraction particle size analyzer, with the dry dispersion module, was utilized to establish the particle size distribution of milk powders under the air pressure of 0.25 MPa.
The Bettersizer 2600 incorporates the combination technology of Fourier and Inverse Fourier design for simultaneous detection of scattered light signals produced by the sample in the forward, lateral, and backward direction.
An inclined sample cell is used in order to diminish the effect of total internal reflection and produce a broad measuring range. This pioneering technology offers high resolution and accuracy.
Therefore, the Bettersizer 2600 is a practical sizing tool, especially when investigating the size distribution of fat and casein particles, in addition to their interactions.
Particle Size Analysis of Skimmed Milk and Full-Fat Milk Powder of Different Brands
Different brands of skimmed milk powder and full-fat powder (Brand A and B) were selected for the investigation of the effect various production techniques and fat content have on the particle size distribution of milk powder.
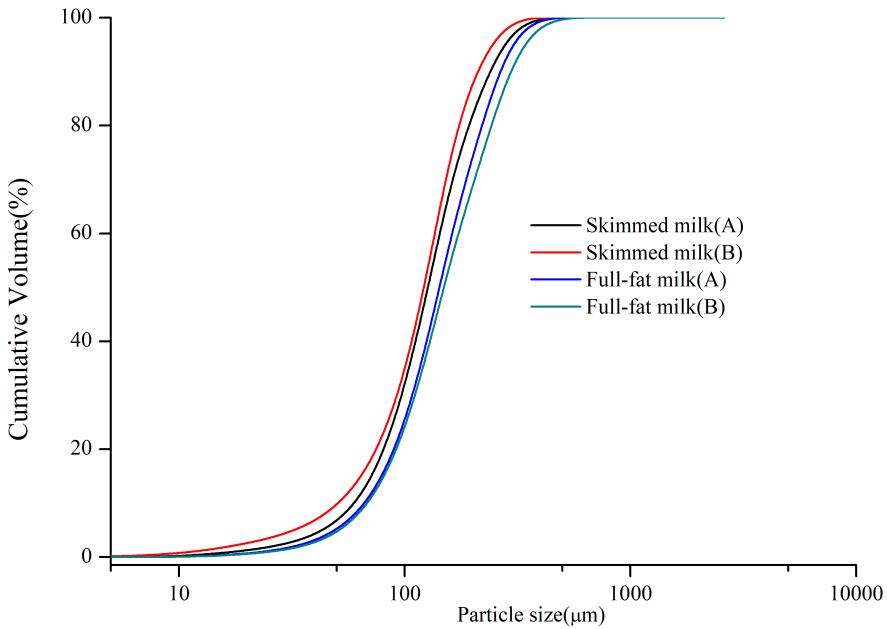
Figure 1. Cumulative volume versus size distributions of skimmed milk and full-fat milk of Brand A and B. Image Credit: Bettersize Instruments
As illustrated in Figure 1, the average particle size of full-fat milk powder is considerably greater than that of the skimmed milk powder. Additionally, Brand A’s skimmed milk powder average particle size was larger than Brand B's. However, the full-fat milk powders are larger in particle size from Brand B instead of Brand A.
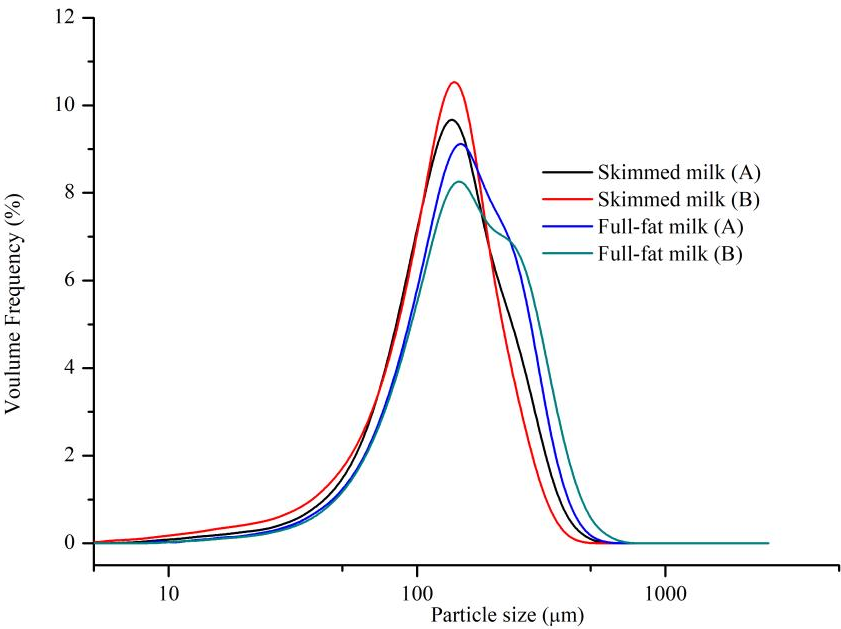
Figure 2. Particle size distributions of skimmed milk and full-fat milk of Brand A and B. Image Credit: Bettersize Instruments
As shown in Figure 2 and Figure 3, the D50 of full-fat milk powder is within the range of 142 μm-149 μm, and the D50 of skimmed milk is within the range of 121 μm-126 μm. This determines that the average particle size of full-fat milk powder is larger than that of the skimmed milk powder.
This is likely the result of full-fat milk powders of both Brand A and Brand B containing 48% of fat, and particle agglomerates with larger diameters are formed due to the fat particles in the full-fat milk powders being easily aggregated onto the surface of casein particles.
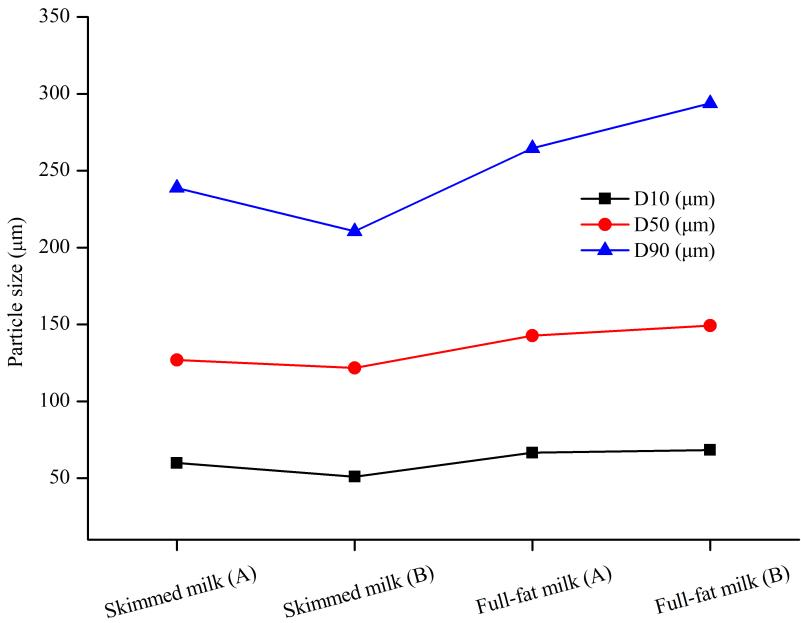
Figure 3. Particle size distributions of skimmed milk and full-fat milk of Brand A and B. Image Credit: Bettersize Instruments
It is clear to see from Figure 2 and Figure 3 that Brand A’s average particle size of skimmed milk powder is larger than that of Brand B, while the average particle size of full-fat milk powder of Brand A is less than that of Brand B.
This difference is likely a result of the diverse parameter settings utilized when manufacturing the same type of milk powder across various brands. Different settings in the spray drying process (air inlet and outlet temperatures, nozzle air pressure and rotational speed) can shape the particle size of the milk powder.
Additionally, homogeneous mixing speed and pressure also affect the particle size distribution of the milk powder. Slow homogenous speeds, or if the homogeneous time is short, could mean that some overly large fat particles may not be broken down, which results in larger powder particle size.
Particle Size Analysis of Milk Powders Adjusted for Different Age Groups
As illustrated in Figure 1, the average particle size of full-fat milk powder is considerably larger than that of the skimmed milk powder. The average particle size of Brand A’s skimmed milk powder was larger than Brand B's. However, Brand B’s full-fat milk powders are larger in particle in contrast to Brand A.
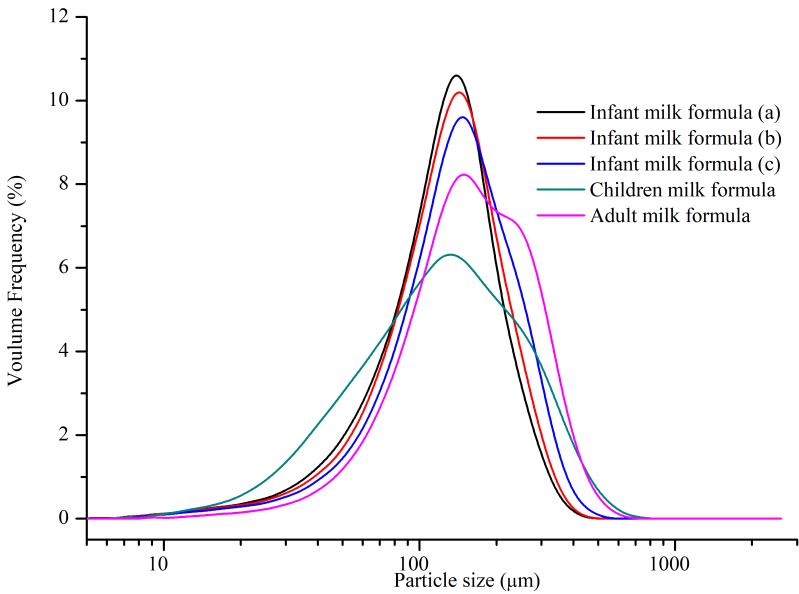
Figure 4. Particle size distribution of milk powder for different age groups. Image Credit: Bettersize Instruments
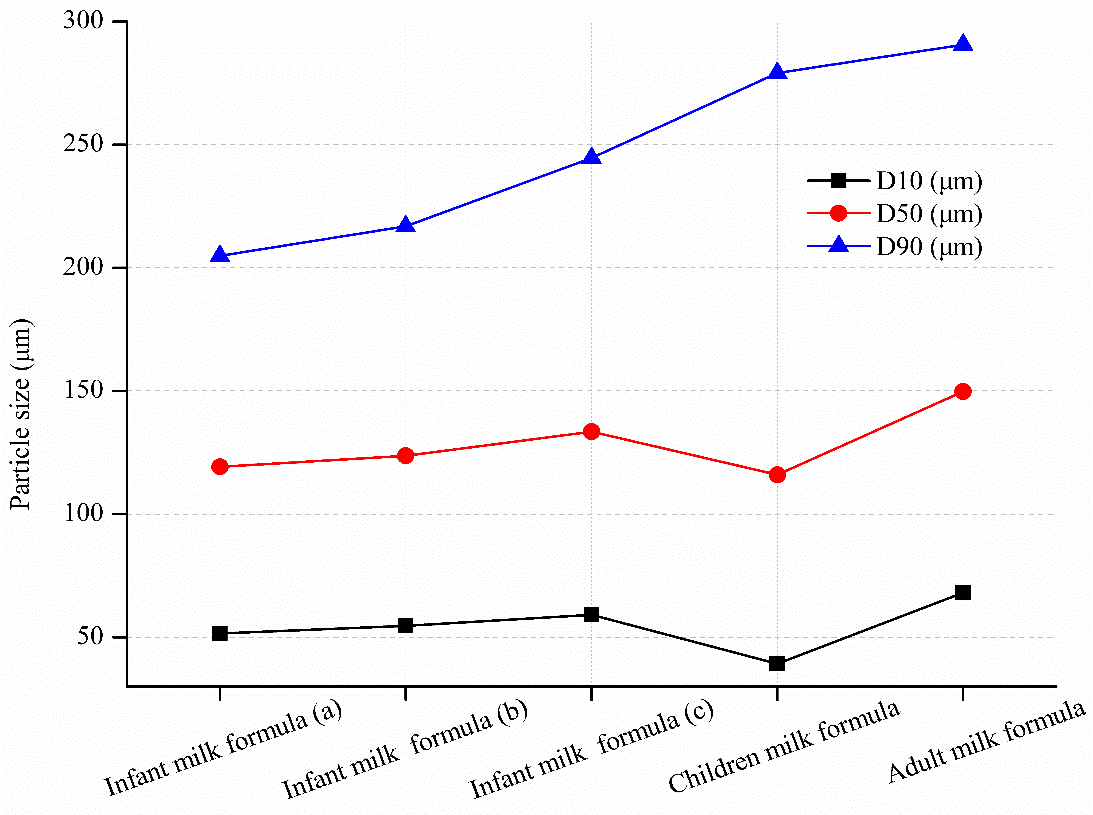
Figure 5. Particle size distribution of milk powder for different age groups. Image Credit: Bettersize Instruments
(1) Particle Size Analysis of Infant Milk Powders
As exhibited in Figure 4 and Figure 5, there are variations in particle size between infant milk formulas at various stages of infancy.
The particle sizes of formula milk powders ascend in the following order: infant milk formula (a) (suitable for infants from 0 to 6 months), infant milk formula (b) (suitable for infants from 6 to 12 months), infant milk formula (c) (suitable for infants from 12 to 36 months).
The particle size increase in the milk powders could be down to the increased ability of an infants’ digestive system and an increase in satiety needs later in the infants' life.
Therefore, it is crucial to adjust the nutritional composition ratio of infant milk formula relative to age. Meanwhile, in order to best replicate breast milk at various stages, the nutritional ratio of infant milk formula will be modified accordingly.
Typically, the proportion of whey protein in infant milk formula between 6-12 months and infant milk formula between 12-36 months will gently decrease, while the content of casein will progressively increase.
Most of the casein in infant milk formula exists in micellar form, and it is bound by the fat particles to produce large particle masses, thus impacting the particle size distribution of the milk powder.
On the contrary, the diameter of casein micelles in the milk powder may increase due to the interactions between casein micelles and whey proteins during the evaporation and drying stages. This is a result of the aggregation of casein micelles or the binding of whey proteins to micelles.
(2) Particle Size Analysis of Milk Powder of Different Stage Group
As illustrated in Figure 5, the mean particle size distribution of adult milk formula is considerably greater than that of infant milk formula and children's milk formula at all stages. This is likely related to the fact adult milk formula has a larger fat content compared to infant milk formula and children's milk formula.
A large amount of casein in adult milk formula attaches to the surface of the fat particles forming large, stable particles, which results in a larger particle size of adult milk formula.
Figure 5 demonstrates that the D90 of infant milk formula, children milk formula and adult milk formula increases gradually, which signifies an increase in the coarse content particles of milk powder. This result is caused by the gradual increase of casein content in milk powder formula as the age range increases.
Figure 5 also demonstrates that the D50s of infant milk formula, children milk formula and adult milk formula range from 119 to 133 μm, 116 μm, and around 150 μm, respectively. However, the D10 and D50 of the children’s milk powder are less than those of the adult milk powder and infant milk powder.
This could be associated with the mechanical wear of the agglomerated particles during processing, packaging, and transportation. When the milk powder particles collide with each other or with the container wall, the particles can easily break up, which reduces both the size of the particles as well as the flow performance of the powder.
Conclusion
In the production and application process of milk powder, the size of the milk powder particles directly influences the final taste, sensory properties, and quality characteristics.
The Bettersizer 2600 is a useful tool for milk powder manufacturers or relevant equipment manufacturers in order to precisely monitor any size changes of milk powder during production, packaging, storage and application process, as well as an improved understanding of the relationship between dairy product formulation and quality

This information has been sourced, reviewed and adapted from materials provided by Bettersize Instruments.
For more information on this source, please visit Bettersize Instruments.