As foodstuff comes in such a vast range of textures and structures, the variety of rheological techniques utilized to characterize its mechanical properties is even bigger. Throughout the entire life cycle of solid or liquid food formulations, rheological and texture properties play a key role.

Image Credit: Thermo Fisher Scientific – Materials & Structural Analysis
Beginning with simple single-point viscosity measurements in the original containers for batch release in production, over the determination of classical rheological parameters such as yield point or shear viscosity for quality control purposes, with comprehensive rheological investigations for the development of new formulations in the research and development department the mechanical testing of foods reaches a certain level of complexity.

Figure 1. HAAKE MARS iQ Rheometer with Peltier plate temperature control for use with parallel-plate and cone-and-plate geometries. Image Credit: Thermo Fisher Scientific – Materials & Structural Analysis
While some techniques rely on classic rheometer geometries such as cone and plate, parallel plates, or coaxial cylinders, some other techniques aim to emulate a certain application by using special rotors and/or measuring fixtures.
Studying the texture of food products is one such application as it must match the expectations of the consumer. A rotational rheometer is able to test a number of vital food properties like stickiness, softness, or spreadability and can even be used for carrying out tribological tests by using probes that are specially designed.
In this application, selected rheometer accessories and physical measurements of a number of food products will be assessed by utilizing a modular rheometer that is designed for quality control and product development purposes.
This includes customized setups for a comprehensive mechanical investigation of food formulations as well as measuring ‘classic’ rheological properties such as yield stress and viscosity.
Materials and Methods
The Thermo Scientific™ HAAKE™ MARS™ iQ Rheometer with a mechanical bearing (Figure 1) was used to assess different commercially available food products. Some of the tests carried out included:
- Breaking and squeezing tests
- Viscosity and yield stress measurements
- Axial bending
- Tribological measurements
Shear rate-dependent viscosity was established by steady-state shear-rate step tests in a range from 0.1 to 100 s-1 and yield stresses were established by shear stress ramp tests.
Different assessment techniques were employed to establish distinct values for the yield stress. All viscosity and yield stress tests were carried out using a 60 mm parallel plate geometry.
Parallel plates with a serrated (crosshatched) surface profile were employed in order to avoid sample slippage during the measurement. Friction coefficients were measured as a function of the circumferential velocity (sliding speed) in a range from 0.001 to 1000 mm/s to assess the tribological profile of different food products.

Figure 2. Tribology setup for HAAKE MARS iQ Rheometer based on the ball-on 3-plates principle. Image Credit: Thermo Fisher Scientific – Materials & Structural Analysis
The tribological measuring fixture that was utilized was based on the ballon-3 plates principle, as seen in Figure 2. The ball and the three plates were both made of hardened stainless steel.

Figure 3. 3-point-bending-tool for performing bend-ing and breaking tests with the HAAKE MARS iQ Rheometer with 8 mm plate rotor. Image Credit: Thermo Fisher Scientific – Materials & Structural Analysis
A 3-point bending tool was utilized to carry out the bending and breaking tests, as shown in Figure 3. Axial ramp tests at a defined set value for the lift speed were performed using this setup. The resulting normal forces were recorded and analyzed. Axial squeeze tests were carried out using a 35 mm diameter parallel plate setup.
Results and Discussion
Viscosity and Yield Stress Measurements
During their entire life-cycle, liquid and semisolid food formulations are exposed to a large variety of shear conditions. For instance, very low shear rates are applied during storage when only gravitational forces are present.
Medium-to-high shear rates are seen during production (mixing, pumping or stirring) and consumption (oral processing). So, when carrying out single point viscosity measurements at one rotational speed only, an incomplete picture of the viscous properties is produced, which does not reflect the true nature of the tested material.

Figure 4. Steady-state-viscosity η (blues symbols) and shear stress τ (green symbols) as a function of shear rate γ for three different mayonnaise products. Image Credit: Thermo Fisher Scientific – Materials & Structural Analysis
In order to estimate how a specific food product will behave under different shear conditions, only a complete flow curve over a wide shear rate range can supply the information needed. Figure 4 exhibits the results of steady-state shear rate step tests of three mayonnaise products that are commercially available.
All mayonnaises showed significant shear thinning behavior in the investigated shear rate range, as expected for emulsion-based food products. Starting at a viscosity of around 1000 Pas at 0.1 s-1 all three samples drop to values below 1 Pas at around 800 s-1.
At shear rates above 800 s-1 the sample was ejected out of the geometry leading to a dramatic drop in viscosity and shear stress. That faulty data was removed in Figure 4. For many semisolid food products, exhibiting such a shear thinning profile is a desired behavior.
High viscosity at low shear rates contributes to the overall stability of a product as it prevents phase separation of multicomponent foods. Yet, in general, too high of a viscosity at higher shear rates is undesirable.
Since it has drawbacks for the application (spoonability, spreadability) and consumption (swallowing, chewing), it is also demonstrated in Figure 4 that a steady behavior of the shear stress signal at low shear was present for all samples, indicating a yielding behavior.
The plateau was happening at almost identical shear stress values of 120 Pa for the regular mayonnaise and the version that contains yogurt. The low-fat version yielded at a lower shear stress of 90 Pa.
In addition to quality control, yield stresses are considered to be a key parameter in research to describe the ‘flow’ behavior of many structured fluids and semisolids.
A yield stress is able to enhance the stability of dispersed systems by preventing sedimentation or, for instance, simply keeping ketchup from sinking in too much into French fries instead of forming a thick layer on top of the fries.
Yield stresses are also connected to certain food properties, which are thought to be important during oral consumption, like initial firmness [2]. Yet, the measured value of a yield stress is strongly dependent on the chosen rheological measuring method, sample handling, data evaluation and even the measuring geometry that is chosen for testing.
Carrying out a shear stress ramp test where a linearly increasing shear stress is applied and the deformation or the viscosity is monitored is a common way to assess the yielding behavior of a sample very precisely.
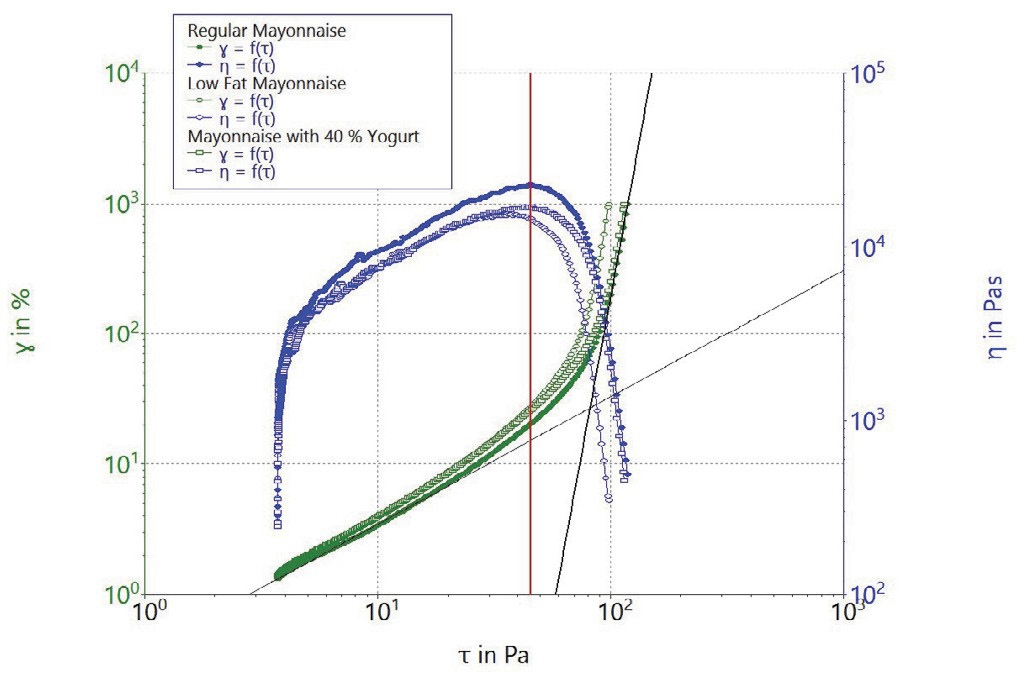
Figure 5. Deformation γ (green symbols) and viscosity η (blue symbols) as a function of shear stress τ for three different mayonnaise products. The red line indicates the yield stress according to the maximum in viscosity for the regular mayonnaise. The black lines are the tangents applied to the different regions of deformation (elastic deformation and steady flow). The intersection of both tangents represents an alternative method for the yield stress determination. Image Credit: Thermo Fisher Scientific – Materials & Structural Analysis
Figure 5 shows the results of stress ramp experiments executed with the same mayonnaise samples utilized for the steady-state shear tests.
The deformation stress curves exhibited in Figure 5 show three distinct regions. In the first region, at low stresses below the yield stress threshold, the samples underwent an elastic deformation. Here the slope of the deformation stress curve is not much bigger than 1 in the double logarithmic plot.
The deformation started to change more quickly and the slope increased as the stress was heightened and neared the yield stress value of the sample. A second linear region with a significantly higher slope was seen at higher shear stresses.
Steady flow occurred in this region and the microstructure was changed by these higher shear forces. Applying tangents to the two linear regions is a common way to calculate the yield stress out of a deformation curve. The yield stress then corresponds to the stress value at the intersection of the tangents.
This technique was utilized in Figure 5 to establish the yield stress of the regular mayonnaise sample (black lines). The corresponding yield stress value was at 82 Pa. The tangent technique supplies a yield stress which is located closer to the middle of a transition range between steady flow and elastic deformation.
Using the maximum in viscosity as a measure is another way to determine the yield stress from a shear stress ramp test. This technique was also applied and can be seen in Figure 5 (red line). The corresponding yield stress value was at 45 Pa and clearly lower than the value derived from the tangents technique.
Figure 5 shows that the maximum in viscosity happened more at the start of the transition and deformation just left the region of almost pure elastic deformation behavior.
Table 1 provides an overview of the yield stress values derived from the different evaluation techniques. It also includes the shear stress plateau values from the steady-state shear rate step tests.
Table 1. Yield stresses of different mayonnaise obtained from different rheological tests and evaluation methods. Source: Thermo Fisher Scientific – Materials & Structural Analysis
| Test / evaluation method |
Mayonnaise
type |
Stress ramp
maximum viscosity |
Stress ramp
tangent intersection |
Steady-state step-test
stress plateau |
| Regular |
45 Pa |
82 Pa |
116 Pa |
| Low fat |
37 Pa |
70 Pa |
89 Pa |
| 40% yogurt |
45 Pa |
83 Pa |
119 Pa |
It can be observed that this value supplied the biggest value for the apparent yield stress, which corresponds to the fact that the data has been gathered at the start of a rotational test and so the sample is already at the end of its transition between elastic and viscous behavior.
It can generally be said that when the experimental setup and the evaluation technique are identical, yield stresses of different materials can be compared.
Texture Analysis
In addition to the classic rheological test methods described above, food formulations are frequently characterized by their textural properties. A texture analyzer aims to simulate a real-world treatment of food like chewing, scooping, spreading or breaking.
This is done by moving a measuring geometry onto or into a food formulation with either a defined force recording the resulting deformation or with a defined speed while recording the force necessary to do so.
Sensitive axial force control and precise lift movement are inherent capabilities of a modern rheometer which means that it is quite simple to utilize a rheometer for texture analysis.
In instances where the normal measuring geometries such as plates, cones, or cylinders are not suitable for such a texture test, by utilizing a universal adapter fixture, almost any kind of special measuring geometry can be adapted.
For sweets, where the desired mouthfeel during chewing is a key part of their success, marshmallows are a typical example. Marshmallows were placed onto the lower plate of the rheometer’s measuring geometry and a 35 mm plate was used to squeeze them down to 8 mm height with a speed of 5 mm/s in order to simulate chewing behavior.

Figure 6. 12 cycles of compression and relaxation of a marsh-mallow. The black Curve shows the down and up movement of the upper geometry. The green curve shows the corresponding changes in the force needed to compress the sample. Image Credit: Thermo Fisher Scientific – Materials & Structural Analysis
Then the top plate went up again with the same speed and afterward, the squeezing step was repeated numerous times to simulate chewing. Figure 6 shows the results of this testing.
At each compression step, the maximum force went down from cycle to cycle, suggesting that the marshmallow became softer simply because of repeated compression without any influence of liquid (saliva).
Another important property for certain types of food like biscuits or chocolate is the breaking behavior. For chocolate, it needs to fulfill the consumer’s expectations. For instance, a dark chocolate is expected to be harder or even brittle, whereas a milk chocolate is expected to be softer.
It becomes a bit more complicated when it comes to the texture of biscuits. This is because starch-based products typically change their texture over time due to the influence of air humidity.
So, apart from their initial properties, the aging of biscuits is also a topic for investigation where the usual force needed to break the biscuit and the amount of bending before the biscuit breaks were assessed.
Biscuits were placed onto the 3-point-bending-tool to test the breaking behavior, as seen in Figure 3. A plate rotor with a diameter of 8 mm was chosen as the upper part of the measuring geometry. The starting position of the upper geometry was chosen sufficiently high enough to enable the convenient positioning of the biscuits.
In order to detect the surface of the biscuit with a sensing force of 0.1 N, the upper geometry moved downwards with 0.1 mm/min. From there, the upper geometry continued downwards with 1 mm/min, breaking and bending the biscuit.
By utilizing the loop function in the Thermo Scientific™ HAAKE™ RheoWin™ Software, the measuring geometry was lifted up again afterward so that the user could place the next biscuit.
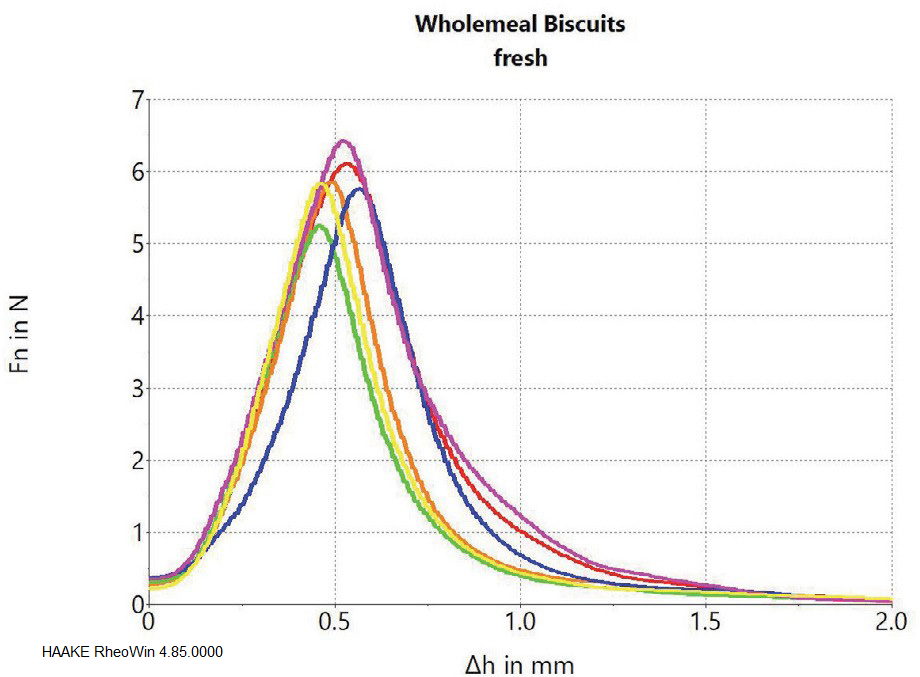
Figure 7. Multiple breaking tests with fresh wholemeal biscuits. Image Credit: Thermo Fisher Scientific – Materials & Structural Analysis
The results of a number of tests on fresh biscuits immediately after opening the packages exhibited some scattering in maximum bending and breaking force as expected when testing samples based on natural raw materials, as seen in Figure 7.

Figure 8. Multiple breaking tests with aged wholemeal biscuits. Image Credit: Thermo Fisher Scientific – Materials & Structural Analysis
The same tests were repeated two weeks after the biscuit package was opened and the results are shown in Figure 8. The amount of bending slightly increased, and the maximum of the force curves became broader compared to the fresh biscuits, showing that slight aging had happened over this time period.
Tribological Tests
Tribology is a field of mechanical engineering and materials science which deals with the properties of interacting surfaces in relative motion. It includes the study and application of the principles of lubrication, friction and wear.
Tribological measurements have raised interest in the field of food science as an additional method that can be used to describe the complex concept of mouthfeel and texture.
Surfaces of different materials and roughness have been utilized in order to simulate the complex interaction of food (saliva), tongue and palate during oral processing [Ref 2].
Correlating tribological parameters, like the friction coefficient, with textural mouthfeel properties such as creaminess or fattiness usually derived from sensory panels is the ultimate goal.

Figure 9. General shape and regions of a Stribeck curve for tribology measurements. Image Credit: Thermo Fisher Scientific – Materials & Structural Analysis
Tribological data is usually presented in the form of a Stribeck curve, where the friction coefficient is shown as a function of the sliding speed. The general form of a Stribeck curve is demonstrated in Figure 9 and it can be divided in three regions.
The behavior is dominated by direct solid/solid contact when at low sliding speeds where no lubricating film is present. This part is known as the boundary lubrication range, and the resulting coefficients of friction are high.
The increasing hydrodynamic pressure of the lubricating sample is causing the development of a lubricating film between the two surfaces when at medium sliding speeds, and the coefficient of friction will begin to drop.
The lubricating film has separated the two surfaces completely at high sliding speeds, and no solid/solid interactions exist. The coefficient of friction will begin to increase again in this hydrodynamic lubrication range.

Figure 10. Stribeck curves (friction coefficient µf as function of sliding speed vR) of two different chocolate spreads and an olive oil. Image Credit: Thermo Fisher Scientific – Materials & Structural Analysis
Generally, it can be said that the lower the coefficient of friction, the better the lubricating properties of a liquid/semisolid surface system. Figure 10 demonstrates the comparison of Stribeck curves gathered from tribological tests with two different chocolate spread products and olive oil on a ball-on-3-plates setup.
The graph shows the different lubrication properties of the olive oil compared to the two chocolate spreads. The chocolate spreads formed a more stable lubricating film at lower speeds due to their more paste-like structure and higher viscosity.
The lower viscosity of the olive oil had a clear advantage at higher sliding speeds, and it demonstrated the best lubrication properties with the lowest friction coefficients in that range.
The Stribeck curves showed differences between the two spreads. At higher sliding speeds, the friction coefficients were almost identical, chocolate spread 2 demonstrated better lubrication properties at low and medium sliding speeds.
Conclusions
The HAAKE MARS iQ Rheometer with mechanical bearing is a versatile and modular instrument that is ideal for evaluating the mechanical properties of liquid and semisolid food formulations.
It can carry out standard rheological tests to measure shear-rate-dependent viscosity over a wide shear range and yield stresses in stress-controlled measuring mode in addition to more comprehensive texture analysis and tribological tests due to its large amount of measuring geometries and other accessories.
Texture and tribological properties enable a more comprehensive study of oral processing and the general concept of mouth feeling, while viscosity and yield stress are key parameters for predicting the behavior of food products during processing, transport and storage.
The HAAKE MARS iQ Rheometer enables food scientists in R&D to characterize all stages of a product’s life cycle, from its raw materials to its consumption. Rheological tests developed by R&D can then be easily transferred over to quality control departments by utilizing the same HAAKE MARS iQ Rheometer for batch release testing.
References
- C. Küchenmeister-Lehrheuer, K. Oldörp, Fritz Soergel, Tribology measuring geometry for HAAKE MARS rheometers, Thermo Fisher Scientific Product Information P023 (2018).
- J.R. Stokes, M. W. Boehm, S. K. Baier, Oral processing, texture and mouthfeel: From rheology to tribology and, beyond, Current Opinion in Colloid & Interface Science, 18 (2013) 349-359.
Acknowledgments
Produced from materials originally authored by Fabian Meyer and Klaus Oldörp from Thermo Scientific.

This information has been sourced, reviewed and adapted from materials provided by Thermo Fisher Scientific - Elemental Analyzers and Phase Analyzers.
For more information on this source, please visit Thermo Fisher Scientific - Elemental Analyzers and Phase Analyzers.