Additive manufacturing (AM) is a fast-growing field that has seen widespread interest from a range of different industries. Its ability to produce small batches of customized parts or directly fabricate components from 3D CAD models makes it a cost-effective alternative to traditional manufacturing.
Additionally, the layer-by-layer approach used in AM generates less waste than conventional subtractive methods. In metal powder-based processes, for instance, up to 95–98 % of unused powder can be recycled.1
Powder bed fusion (PBF) is a commonly used AM technique involving the sequential spreading of thin powder layers over a build plate. A heat source is then applied to selectively sinter or melt specific areas of the powder bed.
Good flowability is essential for forming a uniform powder layer. Poor flowability can cause discontinuities in the final product, while also affecting layer porosity, which reduces mechanical strength and part quality.2
Flowability is often assessed using Hall and Carney flow rate methods, which measure the time it takes for a set amount of powder to pass through a calibrated orifice.
Although cost-effective and easy to use, these funnel-based methods are highly operator-dependent. Powder aeration can also significantly influence flow behavior, making these techniques best suited for simple comparative testing.3
Modern rheometers can be used to evaluate powder flow in a more controlled and reproducible way. This article highlights the use of powder rheology techniques to assess the flowability of metal powders commonly used in PBF and compares these results with those obtained using the Hall and Carney methods.
Materials and Methods
This study investigates the flow behaviors of a titanium powder (Ti64), an aluminum alloy powder (AlSi10Mg), a copper alloy powder (GRCop–42), and two stainless steel powder batches (316L-A and recycled 316L-B).
Key parameters, including D10, D50, D90 of the particle size distribution, and bulk density for each sample type, are shown in Table 1. D10, D50, and D90 indicate the particle diameters below which 10 %, 50 %, and 90 % of the sample volume is found, respectively.
Table 1. Particle size distribution and respective bulk densities of powder samples. Source: Thermo Fisher Scientific – Materials Characterization
| Sample |
D10 in μm |
D50 in μm |
D90 in μm |
Bulk density in g/ml |
| Ti64 |
25.1 |
40 |
56.2 |
2.6 |
| GRCop–42 |
17.0 |
27.2 |
40.2 |
4.2 |
| AlSi10Mg |
38.3 |
48.8 |
62.6 |
1.4 |
| 316L-A / 316L-B |
18.8 |
28.8 |
40.9 |
4.2 |
Bulk densities and particle sizes were determined according to DIN EN ISO 3923-1 and ISO 13322-2, respectively.
Powder flowability was characterized using a Thermo Scientific™ HAAKE™ MARS™ iQ Rheometer fitted with the powder rheology measuring geometry (Figure 1).
A powder flow test was conducted by measuring the resistance of the powder against the helical motion path of a vane rotor. This path is defined by a helix angle (α) and the tip speed (v_tip) of the rotor. The rheometer controls both via the axial movement of the measuring head and the rotational speed of the rotor (Figure 2).
Used together, the helical path and the twisted shape of the rotor (blades) enable two different movement patterns.
A typical sample conditioning step involves a clockwise rotating downward movement, which removes stress and trapped air from the powder, resulting in a homogeneous, low-stress packing state.
The second movement - a typical test mode - is an anticlockwise rotating downward motion designed to apply high stress and compress the sample.
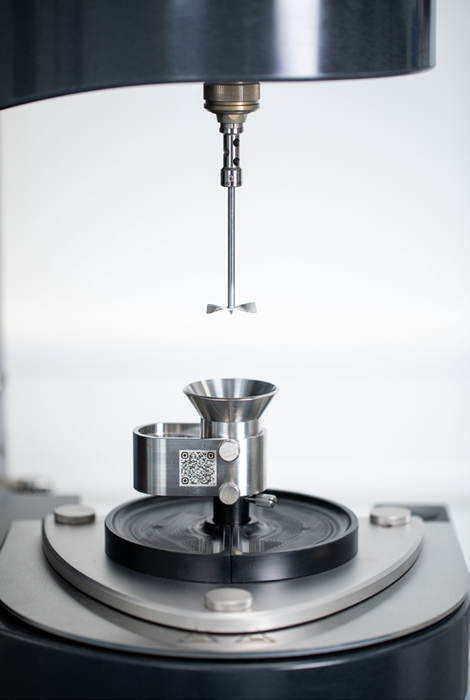
Figure 1. HAAKE MARS iQ Rheometer series with powder rheology accessory for powder flow measurements. Image Credit: Thermo Fisher Scientific – Materials Characterization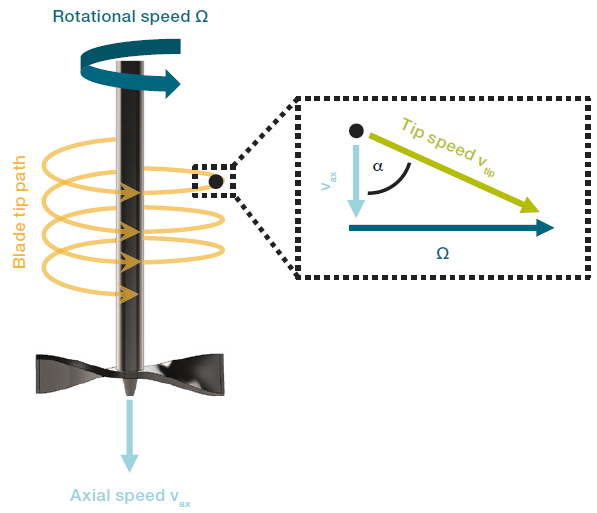
Figure 2. Movement principal a powder flow test. Image Credit: Thermo Fisher Scientific – Materials Characterization
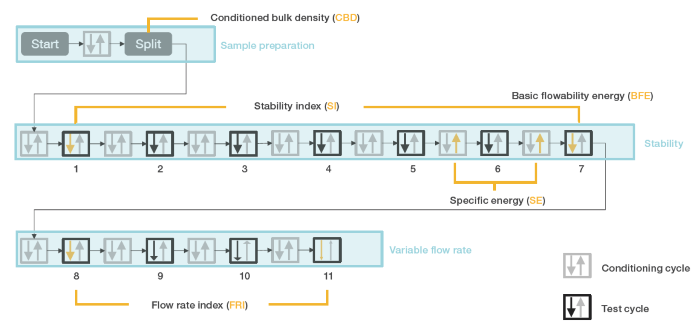
Figure 3. Schematic of complete powder flow measurement procedure. Image Credit: Thermo Fisher Scientific – Materials Characterization
The full powder flow measurement process includes a series of helical upward and downward movements across several conditioning and testing cycles. The complete three-part protocol is shown schematically in Figure 3.
First, the sample is loaded into the measurement geometry up to the funnel (Figure 4A). An initial conditioning cycle at 40 mm/s is performed to remove loading-related stress and entrapped air (Figure 4B). This step ensures the test is operator-independent and that any trapped air is removed to avoid possible aeration of the sample.
Next, the funnel is slid sideways to perform a sample split, removing excess powder to obtain a defined volume of 21.3 ml in the powder flow cup (Figure 4C). The cup is then weighed (Figure 4D), and the powder mass is entered into the Thermo Scientific™ HAAKE™ RheoWin™ software to calculate the conditioned bulk density (CBD).
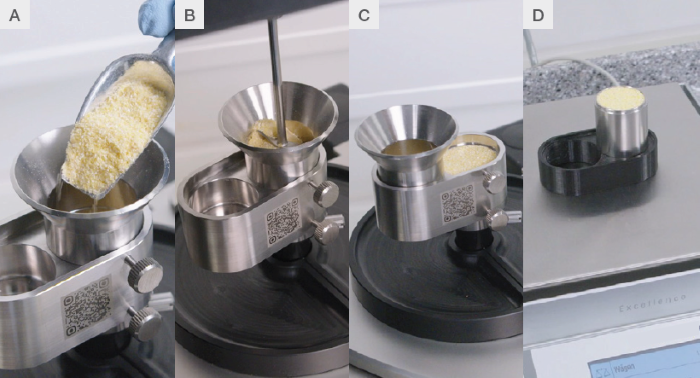
Figure 4. Images at various stages from the sample loading and conditioning procedure for powder flow tests. Image Credit: Thermo Fisher Scientific – Materials Characterization
The second phase, the stability measurement, begins once the conditioned and weighed powder is reinstalled. It involves seven conditioning and test cycles: all conditioning cycles are run at 40 mm/s, and all test cycles at 100 mm/s.
The HAAKE™ RheoWin™ software calculates the flow energy (Eflow) for the downward movement. This evaluation is based on the helix angle (α) employed during the movement and the powder’s resistance against excitation in the form of recorded normal force FN and torque M (Equation 1).
The rotor’s radius, as well as its start and end positions and path, are incorporated into the flow energy calculation to account for the measuring geometry and the distance traveled during the test.
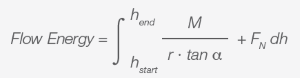
Equation 1
The second part of the powder flow measurement procedure includes an assessment of powder stability during repeated testing using the stability index (SI) (Equation 2).

Equation 2
A sample with an SI value around 1 can be considered stable, and the flow energy from flow cycle 7 can be evaluated as the basic flowability energy (BFE).
The specific energy (SE) can be derived from the 6th and 7th conditioning steps of the stability test, including the sample split mass (Equation 3).
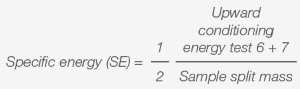
Equation 3
SE is a measure of the energy required to gently shear and lift conditioned powder during the rotor’s upward movement in the powder sample.
This is used to evaluate powder flow behavior in a low-stress state, particularly regarding particle interlocking caused by variations in particle shape, texture, and cohesion.
The third and final part of the powder flow measurement consists of four alternating conditioning and test cycles.
The conditioning tip speed is set to 40 mm/s, while the test tip speed decreases with each cycle, starting at 100 mm/s and sequentially dropping to 70 mm/s, 50 mm/s, and 25 mm/s.
This part of the procedure is used to describe the powder’s sensitivity to changes in flow rate using the flow rate index (FRI) (Equation 4).

Equation 4
The helix angle for every cycle was set to 5 °. Figure 5 shows the respective HAAKE™ RheoWin™ measurement procedure.
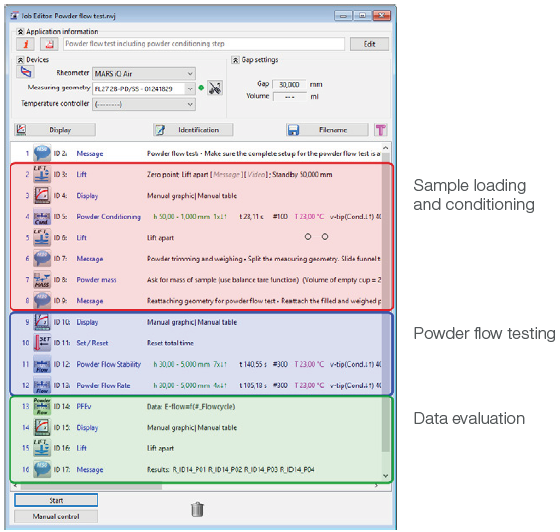
Figure 5. Powder flow measurement procedure in HAAKE RheoWin Software. Image Credit: Thermo Fisher Scientific – Materials Characterization
Flowability data was also obtained using Hall and Carney flow methods to benchmark the results from the powder flow measurement procedure against industry standards.
Results and Discussion
Bulk Density
Bulk density (BD) is defined as the ratio of powder weight to its occupying volume, including interparticle voids. It is a key metric for assessing the properties of the final part. For example, using powders with low bulk densities in PBF can result in final parts with increased surface roughness.2
A notable benefit of the powder flow measuring procedure is that it offers a series of useful parameters for powder flow assessment while also offering information about CBD.
The procedure’s use of conditioning steps and a powder flow cup with a defined volume helps to eliminate operator dependencies during the sample filling process or the manual reading of a volume value from a beaker’s scale. Figure 6 shows the comparison between BD from Table 1 and CBD.
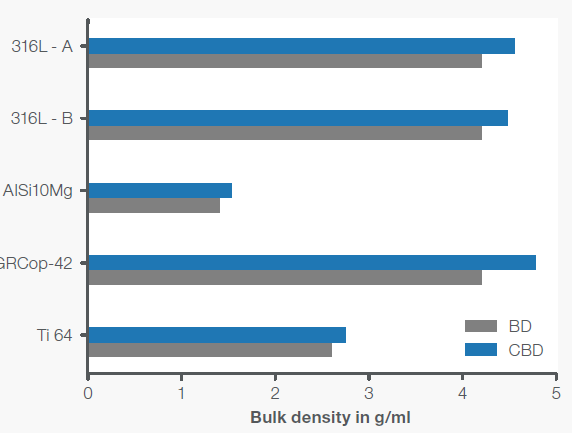
Figure 6. Comparison between bulk density (BD) and conditioned bulk density (CBD). Image Credit: Thermo Fisher Scientific – Materials Characterization
According to ISO 3923-1, BD is determined by the mass of powder flowing through a funnel into a cup of known volume. In contrast, CBD is measured from a conditioned state, in which the powder is gently loosened by the vane rotor to achieve a homogeneously packed state with more closely packed particles.
This key difference means that CBD is always higher than BD, with deviations ranging from 5 % in the case of Ti64 up to 12 % for GRCop-42. Each of these two materials follows the same trend, however, indicating that CBD is an appropriate tool for the comparative bulk density measurement of powders in the scope of the study presented here.
A major advantage of bulk density determination following conditioning versus the funnel method is that the test is operator-independent. Air trapped in the powder as it flows from the funnel into the cup can also lead to an apparent increase in observed bulk density.
Powder Flowability
Only the downward movement of the vane rotor during the test cycle is relevant for most powder flow-related evaluation parameters. Figure 7 displays the flow energies calculated from the torque, alongside the normal force recorded during the helical movement.
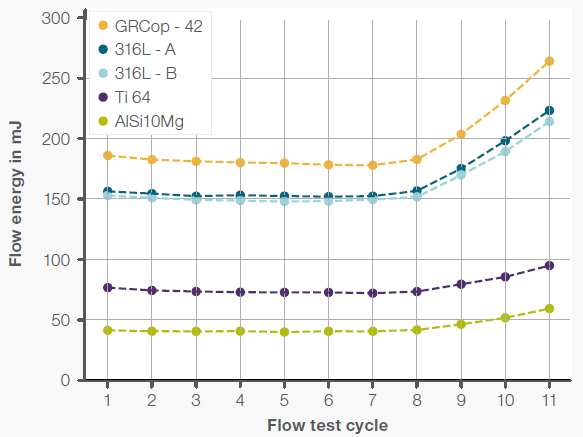
Figure 7. Calculated flow energies as a function of flow test cycle for each powder sample. Image Credit: Thermo Fisher Scientific – Materials Characterization
In the example presented here, AlSi10Mg displays the lowest overall flow energy, indicating it is expected to be highly flowable. This is unusual, as aluminum powders typically tend to agglomerate, leading to poor flowability. However, the powder studied here was optimized by the manufacturer for additive manufacturing, thus improving its flowability.
GRCop-42 exhibited the highest flow energies of all samples in this study, indicating it is likely the least flowable.
Table 2 shows all parameters derived from the powder flow measurements performed.
Table 2. Evaluation parameters derived from the powder flow measurement, as well as Hall and Carney flow. Source: Thermo Fisher Scientific – Materials Characterization
| Sample |
BFE
in mJ |
SI |
SE
in mJ/g |
FRI |
Hall flowability
in s/50 g |
Carney flowability
in s/50 g |
| Ti64 |
71.8 |
0.94 |
0.9 |
1.29 |
45.4 |
- |
| GRCop–42 |
178 |
0.96 |
1.26 |
1.45 |
19 |
4 |
| AlSi10Mg |
40.2 |
0.98 |
0.98 |
1.43 |
44 |
10 |
| 316L-A |
152 |
0.97 |
1.25 |
1.43 |
- |
- |
| 316L-B |
149 |
0.98 |
1.22 |
1.41 |
All powder samples behaved stably throughout the stability test. The SI for all powders is close to 1, indicating no detectable powder friability or electrostatic charging.
BFE appears to correspond well with the flowability results obtained by both Hall and Carney flow, suggesting that high BFE translates to low Hall and Carney flowabilities. The Ti64 sample, however, was not measured using the Carney funnel.
It should also be noted that neither 316L batch could be characterized using any funnel method, as the powder did not flow through the orifice. Nevertheless, the powder flow measurement procedure provided meaningful results for powders that were not entirely free-flowing.
Most powders exhibited an FRI around 1.4, with only Ti64 showing a lower dependency on tip speed changes. This could be due to reduced particle interlocking, resulting in less flow resistance at different rates. The flow behavior of Ti64 changes less when subjected to varying flow rates compared to the other samples.
It is also important to note that all powder flow-related parameters discussed were obtained under confined flow conditions. The powder has limited space inside the powder flow cup to evade the vane rotor’s compressing motion, meaning the sample is pushed downward in front of the blade, resulting in a relatively high-stress state.
SE, however, is determined from the upward movement of the vane rotor. As the rotor gently lifts the powder particles, this creates a low-stress, unconfined flow condition. The primary factor affecting SE is the degree of particle interlocking in low-stress flow.
Ti64 also had the lowest SE, confirming that this powder exhibited reduced particle interlocking, potentially due to smoother particle shapes.
AlSi10Mg also shows a considerably lower SE compared to 316L or GRCop-42. This is similar to Ti64 (and correlates with BFE), with both samples exhibiting the lowest flow energy and best Hall flowability.
These findings align with existing literature, where BFE and SE were correlated with Ti64 powders' irregular shape and particle interlocking.4
Powder flow properties can be linked to layer porosity, layer surface, or layer packing density in parts manufactured via AM, as well as to other powder-related parameters such as particle shape and the size distribution of particle surface properties.2
Conclusion
This article presented an evaluation of the flow characteristics of different metal powders. Powder flow measurement results were compared with bulk density as well as Hall and Carney flow measurements, showing good agreement in each case. It was also observed that powder flow testing enabled the analysis of samples that could not be measured using Hall or Carney flow methods.
In addition to assessing powder flowability in a way comparable to commonly used testing methods, the influence of particle interlocking due to particle shape and morphology can also be evaluated.
These findings demonstrate that the use of appropriate rheometric instrumentation enables the evaluation, control, and optimization of powder performance in additive manufacturing processes.
References and Further Reading
- Ford, S. and Despeisse, M. (2016). Additive manufacturing and sustainability: an exploratory study of the advantages and challenges. Journal of Cleaner Production, (online) 137(1), pp.1573–1587. Available at: https://www.sciencedirect.com/science/article/pii/S0959652616304395.
- Talebi, F.A., et al. (2024). Spreadability of powders for additive manufacturing: A critical review of metrics and characterisation methods. Particuology, 93, pp.211–234. https://doi.org/10.1016/j.partic.2024.06.013.
- Schulze, D., Carson, J., Jelonek, T. and Gbr, V. (2007b) Powders and bulk solids, Springer eBooks. https://doi.org/10.1007/978-3-540-73768-1.
- Mehrabi, M., et al. (2023). An investigation of the effect of powder flowability on the powder spreading in additive manufacturing. Powder Technology, (online) 413, p.117997. https://doi.org/10.1016/j.powtec.2022.117997.
Acknowledgments
Produced from materials originally authored by Philipp Beutler from Thermo Fisher Scientific.

This information has been sourced, reviewed and adapted from materials provided by Thermo Fisher Scientific – Materials Characterization.
For more information on this source, please visit Thermo Fisher Scientific – Materials Characterization.