A number of parameters are critical for optimal performance during an extrusion process. For example, the applied screw speed, the screw configuration, and the thermo-mechanical energy input from the extruder barrel. However, the continuous flow of raw material into the extruder is of the utmost importance.
Raw materials must be fed into the extruder in granular form using a single- or twin-screw feeder to ensure a consistent feed. The materials then enter the extruder barrel before passing through various conveying and kneading zones as part of the extrusion process.
Flowability is a key factor in establishing an effective process that ensures the correct amount of material is fed into the extruder. The flowability of granular materials is strongly influenced by factors such as particle shape, size, and surface properties.
Moisture content must also be considered, as higher moisture levels can form liquid bridges between particles. This promotes agglomeration, increases cohesiveness, and reduces flowability.
Modern rheometers can be used to evaluate the flowability of a wide range of samples. This article explores the use of powder rheology techniques to characterize the flowability of potato starch powder with increased moisture content, with a particular focus on its feedability in food extrusion processes.
Materials and Methods
Two potato starches were used in this study, with respective moisture contents of 17.4 % and 19.7 %.
A Thermo Scientific™ HAAKE™ MARS™ iQ Rheometer fitted with the powder rheology measuring geometry was used to characterize powder flowability. Figure 1 shows the measuring geometries used.
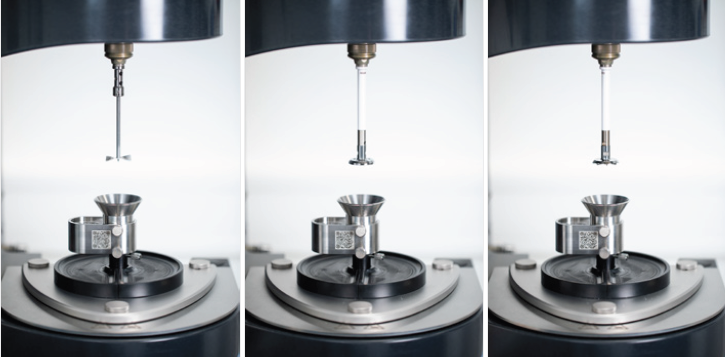
Figure 1. Overview of powder rheology measuring geometries: powder vane rotor (left), porous piston (middle), and powder shear rotor (right), needed to perform powder shear tests. Image Credit: Thermo Fisher Scientific – Materials Characterization
A powder shear test following ASTM D7891 was employed to assess powder flowability. Figure 2 displays the measurement procedure within the Thermo Scientific™ HAAKE™ RheoWin™ software.
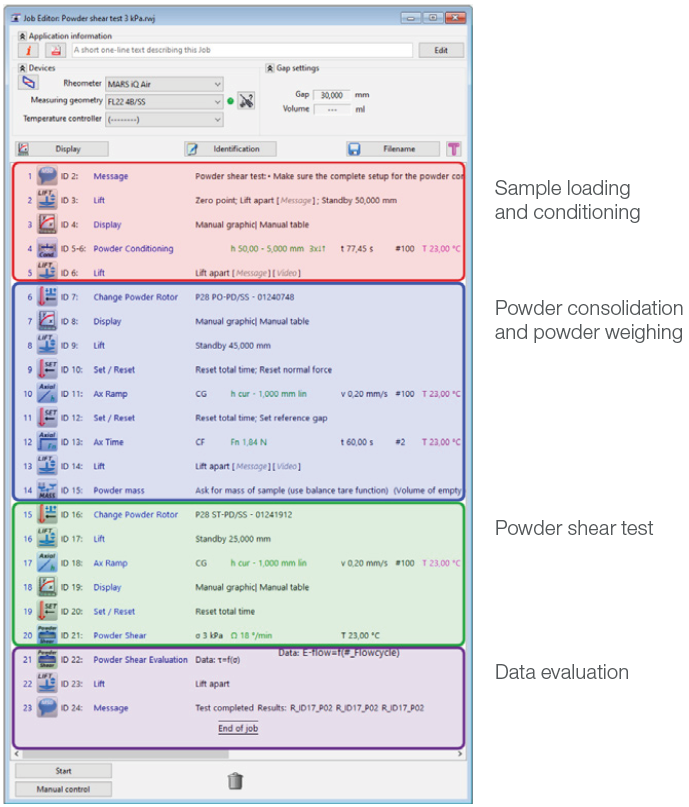
Figure 2. Measurement routine for powder shear test with a pre-shear stress of 3 kPa in the HAAKE RheoWin Software. Image Credit: Thermo Fisher Scientific – Materials Characterization
The sample is loaded into the funnel before an initial conditioning cycle is performed at a tip speed of 40 mm/s. This is done using the powder vane rotor to remove all loading-related stresses and ensure the sample fills the cup homogeneously.
The rotor is then replaced with a porous piston to pre-consolidate the powder. This is done under a constant normal stress of 3 kPa for 1 minute. During this step, the porous body of the piston allows air to escape through the rotor.
Next, the sample is split by sliding the funnel sideways onto the reservoir, removing excess powder, and achieving a defined sample volume of 13.3 ml in the powder shear cup.
The cup is removed from the triangular adapter plate and placed on a scale to determine the powder mass. This value is entered into the HAAKE™ RheoWin™ software, which is then used to calculate the conditioned bulk density (CBD).
The porous piston rotor is then replaced with a powder shear rotor featuring a profiled surface, which is lowered onto the powder bed. The test begins once a normal stress σps of 3 kPa is reached.
The powder shear test consists of multiple shear cycles. First, the powder undergoes a series of pre-shear steps, followed by a single shear step during which the sample fails. At this point, the internal structure can no longer withstand the applied stress, and flow begins.
The rotor rotates at a constant speed of 0.05 rpm during both the pre-shear and shear phases. During pre-shear, a normal stress (σps) is applied to help consolidate the sample. The corresponding shear stress (τps) is then recorded.
The aim of this phase is to ensure that the sample reaches a well-defined and reproducible state of consolidation, referred to as the critically consolidated state, and achieves a steady-state flow condition.1
Once the recorded shear stress from two consecutive steady-state pre-shear phases falls within a tolerance Δ of 2 %, the pre-shear phase is considered complete. If this tolerance is not met, or if a steady state is not achieved, an additional pre-shear step is performed.
In the next shear step, the powder is subjected to a lower normal stress, and the shear stress is recorded until the powder bed fails and begins to flow. The peak shear stress recorded at this point represents a single yield point.
Figure 1 illustrates the principle of applying a pre-shear normal stress (σps) prior to obtaining any yield point at a normal stress (σi) lower than σps.
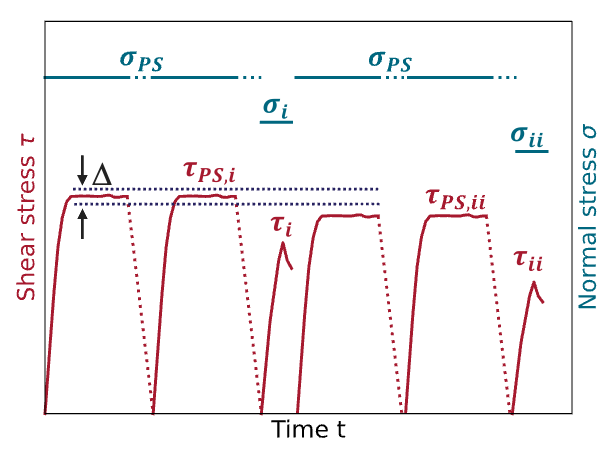
Figure 3. Example shear cycle based on pre-shear phase and shear step. Image Credit: Thermo Fisher Scientific – Materials Characterization
A series of yield points is recorded at various normal stress levels, each preceded by a new pre-shear phase. Table 1 lists the normal stresses used in each pre-shear phase along with the corresponding yield points.
Table 1. Normal stresses for pre-shear and yield points used for this application report. Source: Thermo Fisher Scientific – Materials Characterization
| |
Normal stress σ |
| Pre-shear |
3 kPa |
| 1. Yield point |
2.1 kPa |
| Pre-shear |
3 kPa |
| 2. Yield point |
1.75 kPa |
| Pre-shear |
3 kPa |
| 3. Yield point |
1.5 kPa |
| Pre-shear |
3 kPa |
| 4. Yield point |
1.25 kPa |
| Pre-shear |
3 kPa |
| 5. Yield point |
1 kP |
These yield points are used to generate the yield limit of the consolidated bulk solid in a (σ, τ) diagram, known as the yield locus. This yield locus is valid only for the single consolidation state achieved during pre-shear. Different pre-shear stresses result in different yield loci.1
Different evaluation parameters can be obtained in terms of the yield locus and the pre-shear point. For example, the application of a linear curve fit through the yield locus can show that the τ-axis interception corresponds to the cohesion (C) of the sample.
Samples that are not free-flowing typically exhibit a slightly curved yield locus. However, the cohesion parameter acquired via the τ-axis intercept of the idealized linear curve fit potentially does not correspond to actual sample behavior.2
Two Mohr stress circles are also constructed based on the yield locus and the pre-shear point. This involves a small circle being drawn tangential to the yield locus passing through the origin.
The largest value at which the small circle intercepts the x-axis is referred to as the unconfined yield strength (UYS or σc). The second large circle is drawn tangential to the yield locus, but this circle passes through the pre-shear point (σps, τps).
The largest value at which the large circle intercepts the x-axis is referred to as the major principal stress (MPS or σ1). By definition, the center of both circles is located on the σ-axis.
It is possible to calculate the flow function (FF) based on the ratio of MPS to UYS. Jenike states that it is possible to use the flow function to group the flow of granular materials into different categories (Table 2).3
Table 2. Classification of powder flowability according to Jenike3. Source: Thermo Fisher Scientific – Materials Characterization
| Expected powder flow |
Flow function (FF) |
| Not flowing |
FF > 1 |
| Very cohesive |
1 < FF < 2 |
| Cohesive |
2 < FF < 4 |
| Easy flowing |
4 < FF < 10 |
| Free flowing |
FF > 10 |
It is also possible to determine the effective angle of internal friction (eAIF) by locating a line from the origin of the diagram that touches the larger Mohr circle.
The evaluation of the different parameters based on an example set of shear test data is shown in Figure 4.
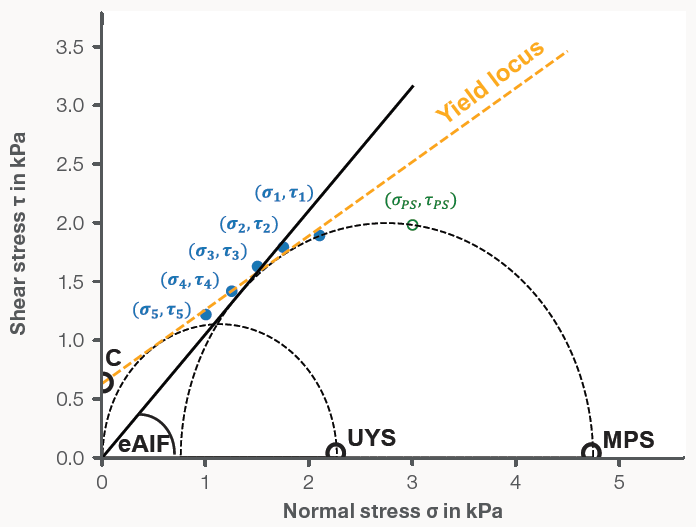
Figure 4. Example shear test data with respective evaluation based on two Mohr stress circles. Image Credit: Thermo Fisher Scientific – Materials Characterization
A gravimetric Kubota Brabender MiniTwin MT feeder was used to record calibration curves to determine the achievable throughput as a function of screw speed. This enabled an assessment of the feeding performance of the two potato starch samples under actual processing conditions.
Results and Discussion
A constant and well-defined supply of raw material is key to ensuring a stable extrusion process. Feeder throughput must be calibrated to precisely control the amount of granular material fed into the extruder. Figure 5 shows a calibration curve for the two potato starch samples investigated.
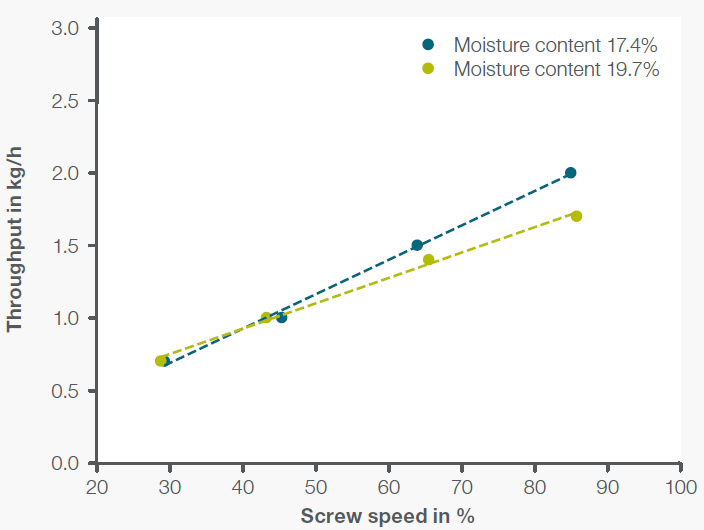
Figure 5. Feeder calibration curve for potato starch with 17.4 % and 19.7 % moisture content. Image Credit: Thermo Fisher Scientific – Materials Characterization
At screw speeds below 50 % of the maximum scale, almost no difference was observed between the 17.4 % and 19.7 % moisture content samples. However, at screw speeds above 50 %, the throughput of the lower-moisture potato starch increased less compared to the higher-moisture sample.
These findings show that a difference of just 1.7 % in moisture content is sufficient to alter feeding behavior, resulting in less powder being fed into the process at higher screw speeds. This means the extruder cannot produce extrudates with consistent quality and texture at higher throughput, as less potato starch is processed.
To understand this change in powder flowability, powder shear tests were conducted as described. Figure 6 presents the powder shear test results for both samples under a pre-shear normal stress of 3 kPa.
Table 3. Evaluation powder shear test results of potato starch with a pre-shear normal stress of 3 kPa. Source: Thermo Fisher Scientific – Materials Characterization
| |
Cohesion (C)
in kPa |
Unconfined yield
stress (UYS
in kPa |
Major principal
stress (MPS
in kPa |
Effective angle of
internal friction
(eAIF) in ° |
Flow Function
(FF) |
| Moisture content 17.4 % |
0.44 |
1.52 |
4.04 |
40.5 |
2.64 |
| Moisture content 19.7 % |
0.40 |
1.53 |
4.41 |
46.4 |
2.88 |
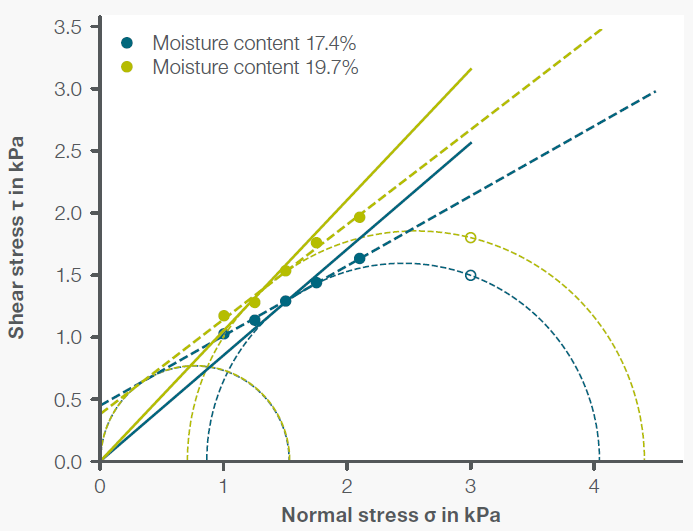
Figure 6. Results powder shear tests on potato starch with 17.4 % and 19.7 % moisture content. Image Credit: Thermo Fisher Scientific – Materials Characterization
Table 3 summarizes the evaluation results based on the two Mohr stress circles. These results show only minimal differences in both cohesion and unconfined yield stress (UYS). This aligns with findings by David J. Sun et al.,4 who identified a proportional relationship between powder cohesion derived from the τ-axis intercept and UYS determined through shear cell testing.
This suggests that the cohesiveness of the sample does not change significantly, with only a 1.7 % difference in water content. However, both the major principal stress (MPS) and the effective angle of internal friction (eAIF) show a stronger dependency on moisture content.
The effect of moisture content on the eAIF is in line with the findings of Stoklosa et al.,5 who found that moisture sorption from ambient air leads to changes in the effective angle of internal friction.
An increase in eAIF with higher moisture content indicates increased friction between planes within the powder, corresponding to reduced flowability. This reduction is likely due to moisture absorption altering the surface of the particles, leading to the formation of liquid bridges between them.
While there is minimal difference in UYS, the flow function of 2.88 shows that the sample with 19.7 % moisture content exhibits slightly more cohesive flow behavior versus the flow function of 2.64 determined for the sample with 17.4 % moisture content.
Flow behavior may differ when powder shear tests are conducted using different pre-shear consolidation stresses. Depending on the application, it may be beneficial to further investigate shear behavior under other conditions by selecting one of the predefined stress tables (e.g., 6, 9, or 15 kPa pre-shear stress) available in the HAAKE™ RheoWin™ software.
Conclusion
This article investigated the influence of moisture content on the flowability of potato starch and its impact on the throughput of a gravimetric feeder used in food extrusion applications.
An increase in moisture content was found to negatively affect throughput, presenting a potential obstacle to establishing an efficient extrusion process.
Powder shear testing proved to be a valuable tool for distinguishing between different moisture levels based on flow function and effective angle of internal friction.
These findings demonstrate that powder performance in extrusion processes can be evaluated, controlled, and optimized, enabling the efficient production of extrudates with the desired texture.
References and Further Reading
- Schulze, D., et al. (2007b) Powders and bulk solids, Springer eBooks. https://doi.org/10.1007/978-3-540-73768-1.
- Ashton, M.D., Cheng, H., Farley, R., and Valentin (1965). Some investigations into the strength and flow properties of powders. Rheologica Acta, 4(3), pp.206–218. https://doi.org/10.1007/bf01969257.
- Jenike, A.W. (1976). Storage and flow of solids. Bulletin No. 123; Vol. 53, No. 26, November 1964. (online) UNT Digital Library. Available at: https://digital.library.unt.edu/ark:/67531/metadc1067072/.
- Sun, D.J. and Sun, C.C. (2019). Proportionality between powder cohesion and unconfined yield strength from shear cell testing. Heliyon, 5(1), p.e01171. https://doi.org/10.1016/j.heliyon.2019.e01171.
- Stoklosa, A.M., et al. (2012). Effects of storage conditions, formulation, and particle size on moisture sorption and flowability of powders: A study of deliquescent ingredient blends. Food Research International, 49(2), pp.783–791. https://doi.org/10.1016/j.foodres.2012.09.034.
Acknowledgments
Produced from materials originally authored by Philipp Beutler and Gabriela Saavedra from Thermo Fisher Scientific.

This information has been sourced, reviewed and adapted from materials provided by Thermo Fisher Scientific – Materials Characterization.
For more information on this source, please visit Thermo Fisher Scientific – Materials Characterization.