The K3® IS camera is able to deliver a powerful combination of low-dose imaging via real-time electron counting, a large field of view and rapid and continuous data capture.
When used as part of a 4D STEM experiment, the STEMx® system provides precision synchronization between the scanning probe’s speed and the camera’s frame rate. This ensures that data acquisition is performed at high speed while eliminating any potential data loss.
Context
Magnetite (Fe3O4) nanoparticles are magnetic materials that offer excellent potential for the treatment of hyperthermia, in use as MRI contrast agents and in performing a vital role as magnetic cores in high switching frequency inductors and transformers.
Each of these very different applications necessitates a material with a robust magnetic saturation (Msat). Studies have highlighted that antiphase boundaries (internal defects) present in the magnetite can adversely affect this value.
The identification of the ideal synthetic conditions for the production of high-quality nanoparticles with a Msat value close to maximum bulk values is, therefore, a worthwhile endeavor.
Materials and Methods
A 4D STEM on a Titan ETEM was used to observe magnetite nanoparticles. A K3 IS camera was also utilized in the determination of counted CBED diffraction patterns throughout the STEM scan.
The total dataset was comprised of an array of 70 x 70-pixel positions with a 1440 x 1023-pixel diffraction pattern obtained at each individual pixel position.
It took approximately 100 seconds to acquire the dataset, and this was captured using a low beam current of 0.3 pA (1.742*106 e-/s), which was successfully measured by the camera.
Virtual SAED apertures were applied to the data using a number of the standard tools available as part of the Gatan Microscopy Suite® (GMS).
Next, Python scripting in GMS was employed in data processing in order to produce a map of pattern orientation and visibility. This was done by measuring the direction and magnitude of the strongest spot in each of the patterns.
Python scripting was also used to produce a maximum pattern, whereby each pixel represented the maximum value of that pixel over all of the patterns in the dataset.
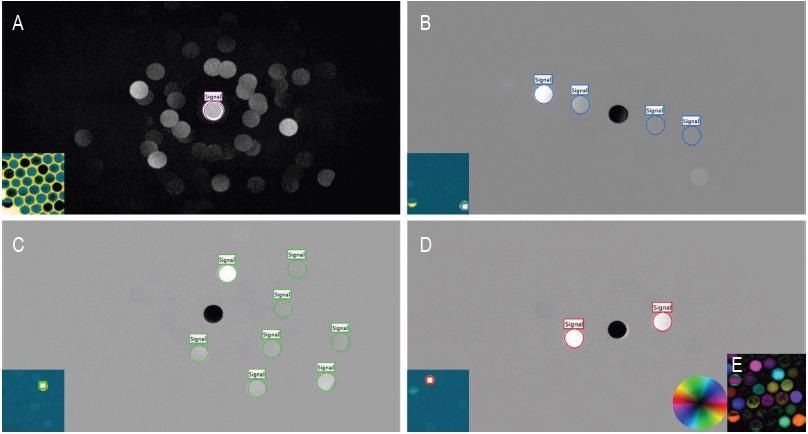
Figure 1. Virtual apertures and orientation mapping. A) Maximum diffraction pattern, where each pixel is the maximum value of that pixel overall patterns in the dataset. Inset: Virtual BF Image from the virtual aperture indicated in A. B – D) Diffraction patterns summed from the square regions specified in the corresponding insets. B – D Insets: Virtual DF images from the virtual apertures indicated in B – D. E) Map of brightest spot orientation and intensity. The color hue in the map specifies the direction from center of the strongest spot in the diffraction pattern, while the brightness corresponds to the intensity of this peak. The average pattern overall pixels was subtracted from the data. Image Credit: Gatan Inc.
Summary
It is possible to employ this map of lattice spacing orientation to establish which particles are similarly oriented and the particle quantity in instances where there is notable structural variation within a single particle.
The K3 IS offers robust and statistically relevant information which highlights the presence of particle defects, allowing batch synthesis to be adapted to effectively produce high-quality, single-crystal magnetite nanoparticles.
As interparticle interactions can negatively impact desired magnetic behavior, there should be a particular emphasis placed on the observation of correlated orientation between particles.

This information has been sourced, reviewed and adapted from materials provided by Gatan Inc.
For more information on this source, please visit Gatan Inc.