Since lifting off three years ago, NASA’s Ice, Cloud and Land Elevation Satellite-2 (ICESat-2) has created a comprehensive image of the complexities of ice sheet change and has given insights into the future of both Greenland and Antarctica.
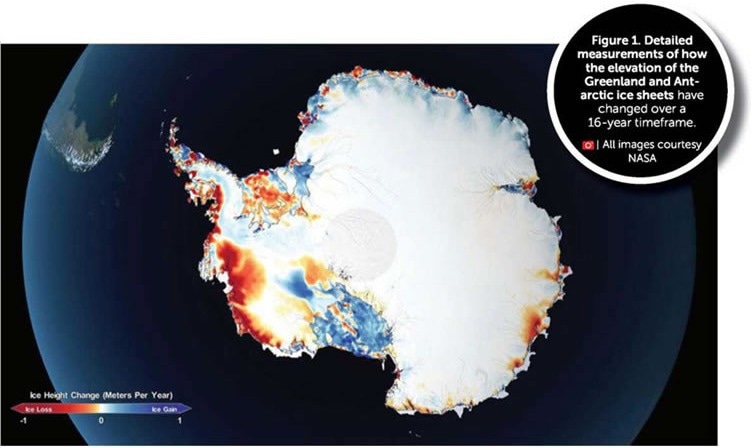
Image Credit: NASA
The ICESat-2 measurements revealed that the ice sheet in Antarctica is getting thicker in areas of the continent’s interior when compared to data taken from the original ICESat from 2003 to 2009, likely due to an increase in snowfall.
However, the huge loss of ice from the continent’s margins (as a result of ocean warming) is far more significant than any small gains in the interior.
The new analysis reveals the ice sheets’ response to changes in climate with unprecedented detail, revealing clues as to why and how the ice sheets are reacting the way they are.
Alex Gardner, Glaciologist, NASA’s Jet Propulsion Laboratory.
This is one of the first times that researchers have utilized laser altimetry to determine the loss of Antarctica’s ice sheet simultaneously with the depletion of the floating ice shelves around the continent.
The researchers observed that ice shelves are depleting in West Antarctica - the location of many of the continent’s most quickly-moving glaciers.
Patterns of thinning across the ice shelves in West Antarctica reveal that Crosson ice shelves have thinned an average of around 10 ft of ice per year, and Thwaites ice shelves around 16 ft of ice per year - the most of any ice shelves.
Measuring by Space Lasers
The ICESat-2 spacecraft acts as a power and pointing platform for the mission’s only instrument, the Advanced Topographic Laser Altimeter System, or ATLAS. This is a space-based LIDAR (Light Detection and Ranging), used to measure distance by aiming a laser at a target and analyzing the light which is reflected.
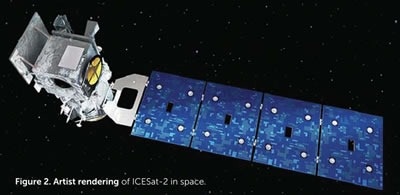
Image Credit: Orbital ATK / Northrop Grumman
ATLAS measures the time taken for laser photons to travel from the satellite to Earth and back; computer programs calculate elevation by using the travel time from multiple pulses.
ATLAS required us to develop new technologies to get the measurements needed by scientists to advance the research. That meant we had to engineer a satellite instrument that not only will collect incredibly precise data, but also will collect more than 250 times as many height measurements as its predecessor.
Doug McLennan, ICESat-2 Project Manager.
Whilst circling Earth from pole to pole, ICESat-2 will measure ice heights four times a year, following an identical path in the polar regions, giving annual and seasonal monitoring of the changes in ice elevation. In addition, beyond the poles, ICESat-2 will measure the height of ocean and land surfaces, including forests.
When ICESat-2 is in orbit, ATLAS creates six green laser beams arranged in three sets of two to more accurately determine the slope of the surface and give better ground coverage.
Each beam pair is 2.1 miles apart across the beam track, and each beam within a pair is separated by 1.6 miles along the beam track. The laser array is rotated 2° from the satellite’s ground track such that a beam pair track is separated by approximately 300 ft.
ATLAS emits laser pulses in the visible spectrum at 532 nm wavelength. Despite being powerful, the laser is not hot enough to melt ice from its position roughly 300 miles above the Earth.
The laser pulse rate, in combination with satellite speed, allows ATLAS to record an elevation measurement every 28 in., comparable to taking 130 images of a single football field. Measurements are recorded at 2.3 ft intervals along the satellite’s ground path.
The laser fires at a rate of 10,000 times a second. Around 200 trillion photons are emitted in each pulse, the vast majority of which are deflected or dispersed as the pulse travels to Earth’s surface and is reflected back to the satellite.
Roughly a dozen photons from each pulse return to the instrument and are received by a 2.6 ft. beryllium telescope. Filters ensure that the instrument exclusively counts photons with a 532 nm wavelength, and computer programs further identify photons that are likely to have come from the laser.
Ensuring ATLAS Can Last
As it was being assembled, ATLAS went through an initial round of testing in the spring and summer of 2016 at the Goddard Space Flight Center, NASA. The testing team subjected it to noise that simulated a noisy rocket launch, jolted it on a vibration table, then put it in a vacuum chamber to test it in extreme cold and extreme heat temperature conditions.
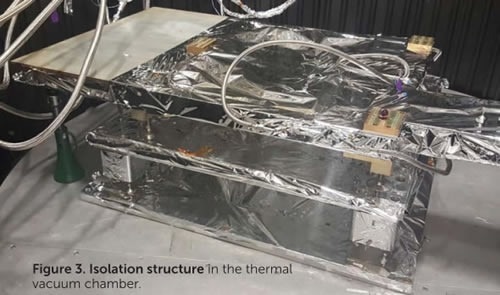
Image Credit: NASA
While ICESat-2 is in orbit, it alternates between basking in the heat of the sun to freezing in the cold shadow of Earth every 90 minutes. Therefore, before the satellite was launched into the harsh conditions of space, Goddard engineers wanted to be sure that the laser worked day and night, consistently, regardless of the temperature.
The vacuum chamber was set up with four vacuum-compatible 800CM-1CV negative-stiffness vibration isolators to support ATLAS for the thermal vacuum testing.
The Minus K isolators’ primary use was inside the thermal chambers which did not have as stable of a mounting surface as we would have liked. The isolators were critical in cancelling out jitter introduced into our system by the facility.
Brian Simpson, Mechanical Lead for ATLAS Testing.
The ICESat-2 team worked continuously to test ATLAS in a temperature-controlled vacuum chamber at Goddard, making sure that its interconnected components worked together and performed as expected.
When we did these tests, we wanted to confirm that in the worst-case conditions on orbit, both hot and cold, with no air, you still get the expected performance that you want from the instrument. It’s an extreme test.
Melody Djam, System Engineer, Goddard.
For this test, engineers determined the maximum temperature the instrument would reach when in orbit in full sun and the minimum temperature in the Earth’s shadow — they then went a further 5° C to cover all bases in a “survival” test. Using heaters and liquid nitrogen, the thermal vacuum cycled between 55° C and -25° C four times.
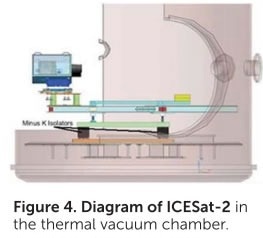
Image Credit: NASA
At each of those extreme temperatures, test engineers sent laser signals through a fiber optic cable specifically designed to simulate laser light reflecting off Earth and returning to the spacecraft.
The team had designed various scenarios that reflect light in different manners — for example, a glacier in summer results in different photon returns than an ocean under cloud cover or a forest in fall.
The instrument must also distinguish between laser photons that it must count and the static of background photons from natural sunlight. This must be done under the range of temperatures that could cause materials to expand or contract.
Specifically-designed ground support equipment, or test fiber optics and lasers simulated all these cases, testing the performance of the ATLAS detectors and electronics, as well as how the computer programs that will receive the data on Earth interpreted those results.
Because our integration and testing process is so long and involved, and because there are so many electronic interfaces, we really wanted to get most of those electronics together in the thermal vacuum tests to see how they all behaved. Problems that we might find during testing, we wouldn’t have otherwise found for another year. It’s a significant risk mitigator for us.
Cathy Richardson, ATLAS Instrument Project Manager, Goddard.
“We really needed to see how everything plays off each other,” Richardson said. “What you care about is the flight hardware working together.” And the avionics system performed well, she said, returning data that was in agreement with what the scientists were expecting to see.
Mapping Subglacial Lakes
ICESat-2 has given scientists the ability to map subglacial lakes with precision. The satellite measures the height of the ice surface, which rises or falls as lakes fill or empty beneath the ice sheet - despite its enormous thickness.
Hydrology systems beneath Antarctica’s ice sheet have been a mystery for decades.
Scientists have hypothesized subglacial water exchange in Antarctica is the result of a combination of factors, including fluctuations in the pressure exerted by the mass of ice weighing down from above, the friction between the bed of the ice sheet and the rocks beneath, as well as heat rising from the Earth below that is insulated by the thick layer of ice.
This is a dramatic contrast to the Greenland ice sheet, where lakes at the bed of the ice fill with meltwater that has drained through from the surface where there are cracks and holes.
Precise measurements of basal meltwater are crucial if scientists want to better understand Antarctica’s subglacial plumbing system and the impact that freshwater may have on the speed of the ice sheet above or the circulation of the ocean into which it eventually flows.
In 2007, Helen Amanda Fricker made a breakthrough that assisted in updating the classical understanding of subglacial lakes in Antarctica.
Using data from the original ICESat, Fricker was the first to discover that an entire network of connected lakes is actively filling and draining over time beneath Antarctica’s fast-flowing ice streams. Previously, these lakes were believed to hold meltwater statically, without filling and draining.
Recently, Fricker, along with another team of scientists, explored this connection between freshwater and the Southern Ocean - this time by studying lakes near the surface of an ice shelf, a great slab of ice that floats on the ocean as an extension of the ice sheet.
Their study reported that in 2019, following a crack or fracture having opened from the lake floor to the base of the Amex Ice Shelf in East Antarctica, a large, ice-covered lake abruptly collapsed.
Using data from ICESat-2, the team analyzed the rugged change in the landscape of the ice shelf. The event left a sinkhole, or doline, a dramatic depression of around four square miles (about 10 square kilometers), or more than three times greater than the size of New York City’s Central Park.
The crack tunneled almost 200 billion gallons of fresh water from the surface of the ice shelf into the ocean below over the course of three days.
In the summer, the surface of Antarctica’s ice shelves are adorned by thousands of turquoise meltwater lakes. Yet this abrupt event took place in the middle of the winter when scientists expected all of the water on the ice shelf’s surface to be frozen.
ICESat-2 orbits Earth with exactly repeating ground tracks, which means that even in the darkness of polar winter, its laser beams are able to show the drastic change in the terrain before and after the lake emptied.
Meltwater streams and lakes are common on Antarctica’s ice shelves in the warmer months, and since scientists expect these meltwater lakes to become more common with increasing air temperatures, the risk of hydrofracturing could also increase in decades to come.
Still, the team concluded it is too soon to determine whether warming in Antarctica’s climate was the cause of the demise of the observed lake on the Amery Ice Shelf.
Witnessing the formation of a doline with altimetry data was a rare opportunity, but it is exactly the kind of event glaciologists must analyze to comprehensively study the ice dynamics that are relevant in models of Antarctica.
We have learned so much about ice sheet dynamic processes from satellite altimetry, it is vital that we plan for the next generation of altimeter satellites to continue this record.
Helen Amanda Fricker.
This recent study provides key insight for locating new subglacial lakes from space and for assessing how this hidden plumbing system affects the rate at which ice slips into the Southern Ocean, adding freshwater that may change its ecosystems and circulation.
This has allowed scientists to improve their maps of these concealed systems of lakes below the West Antarctic ice sheet, as well as discover another two of these active subglacial lakes.
Acknowledgments
Produced from materials originally published by Steve Varma, Operations Manager at Minus K Technology.

This information has been sourced, reviewed, and adapted from materials provided by Minus K Technology.
For more information on this source, please visit Minus K Technology.