Sponsored by EDAXFeb 16 2023Reviewed by Olivia Frost
Lithium (Li)-containing compounds and alloys are vital to many key technologies of the twenty-first century, from Li-ion batteries used to power mobile electronic devices and cars to lightweight structural alloys.
Despite the lack of a method to determine lithium content at the microscale, progress in these fields has been remarkable.
Microanalysis is often performed using Energy Dispersive Spectroscopy (EDS) in a Scanning Electron Microscope (SEM).
However, this has not been possible for elements with atomic number (Z) <4. This is because the characteristic X-Rays emitted (e.g., Li K at 55 eV) are attenuated by the sample or the presence of an oxide layer or contamination and thus necessitate the use of highly specialized detectors.
Nonetheless, a detection limit of 20% Li and the inability to make quantitative measurements owing to the dependency on the Li bonding state pose substantial challenges.1
However, recent research has shown that Li can be quantified in the SEM using a composition-by-difference approach based on EDS and quantitative Backscattered Electron Imaging (qBEI).2
The elements Z = 4 - 94 were quantified using EDS, whereas the mean atomic mass was determined using qBEI (the qBEI signal being a function of atomic number for Z = 1 - 94).
The proportion of light elements (Z = 1 - 3) was computed and presumed to be Li, given the MgLi alloy examined. Detection of 5% Li was achieved using this approach with satisfactory accuracy (1%).
Results and Discussion
The composition by difference approach is extended to produce quantitative, spatially defined elemental maps of a MgAlLi alloy. The nominal makeup of the sample was Mg52.6Li18.3Al29.1 wt.%. The sample was prepared using a Gatan Ilion® polisher and wide-beam argon milling.
The sample was transported to the SEM while soaked in isopropanol to limit interaction with the environment. A field emission SEM was utilized to acquire EDS and qBEI maps at 3 and 5 kV, which were chosen to expose the sample microstructure while providing equivalent signal sampling depths.
EDAX Octane Elite EDS System was used to acquire EDS spectra, and APEX software was used to produce quantified elemental maps. qBEI was done using a Gatan OnPointTM backscattered electron detector and image processing with DigitalMicrograph® software.
Secondary and backscattered electron images (Figure 1) indicated a 61:39 area% eutectic microstructure, which was consistent with thermodynamic models using Thermo-Calc software, while EDS maps revealed an Mg-rich matrix and Al-rich MgAl secondary phase (Figure 1c).
Despite thorough sample treatment, elevated carbon and oxygen concentrations and surface pitting are signs of atmospheric response in certain places.
Sample topography influences the backscattered electron yield, and observable topographic characteristics correspond with 'dark' anomalies in the qBEI data (arrowed). To prevent inaccurate data interpretation, these locations were omitted from the generated elemental maps.
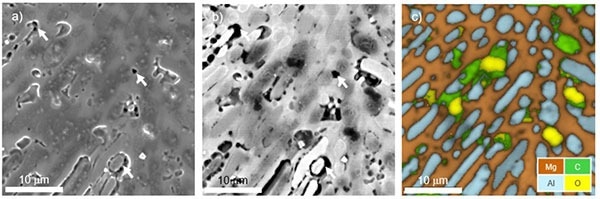
Figure 1. a) Secondary and b) backscattered electron images of MgLiAl alloy; c) elemental map revealing Mg matrix and Al-rich secondary intermetallic phase. Image Credit: EDAX.
The composition by difference approach was used to construct elemental maps for magnesium, aluminum, and, for the first time, lithium (Figure 2).2
The matrix was found to be Mg90.6Li9.4 wt.% with minimal spatial variation; however, the second phase had a large compositional range ranging from Mg26Li11Al63 to Mg10Li43Al47 (mean Li content of 35.5 wt.%).
These findings are consistent with thermodynamic predictions that anticipate an Mg-rich matrix with a BCC Li configuration and an FCC AlLi secondary intermetallic phase capable of supporting a wide range of Mg content.
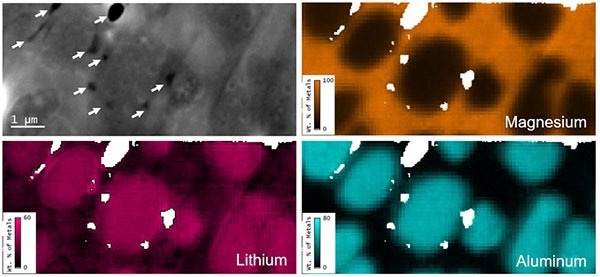
Figure 2. Secondary electron image and elemental metal fraction maps (by wt. %) of the same region of the MgLiAl alloy; white pixels are regions excluded from the analysis due to influence of topography (identified by arrows in the secondary electron image). Image Credit: EDAX.
Conclusion
The findings here demonstrate that single-digit Li mass percentages may be quantitatively mapped in the SEM using the composition by difference approach.
Surface topography, as well as the existence of unknown amounts of H or He, are recognized limitations of the approach (or voids). Despite this, the approach has notable benefits over specialist "Li" EDS detectors.
References
- P. Hovington et al., Scanning 38 (2016) p571–578
- JA. Österreicher et al., Scripta Materialia 194 (2021) 113664

This information has been sourced, reviewed and adapted from materials provided by EDAX.
For more information on this source, please visit EDAX.