The determination of fiber orientation within composite polymers is a critical parameter for the prediction of a material’s behavior. Over time, different methods have been developed to obtain an estimate of the distribution and orientation of reinforcing fiber materials, which works with a fair level of approximation in global modeling.
However, when a local behavior must be studied or more precision is desired in the mathematical modeling of materials, a far more accurate analysis can be carried out, consisting of the combination of computer-aided tomography (CT) and image processing software.
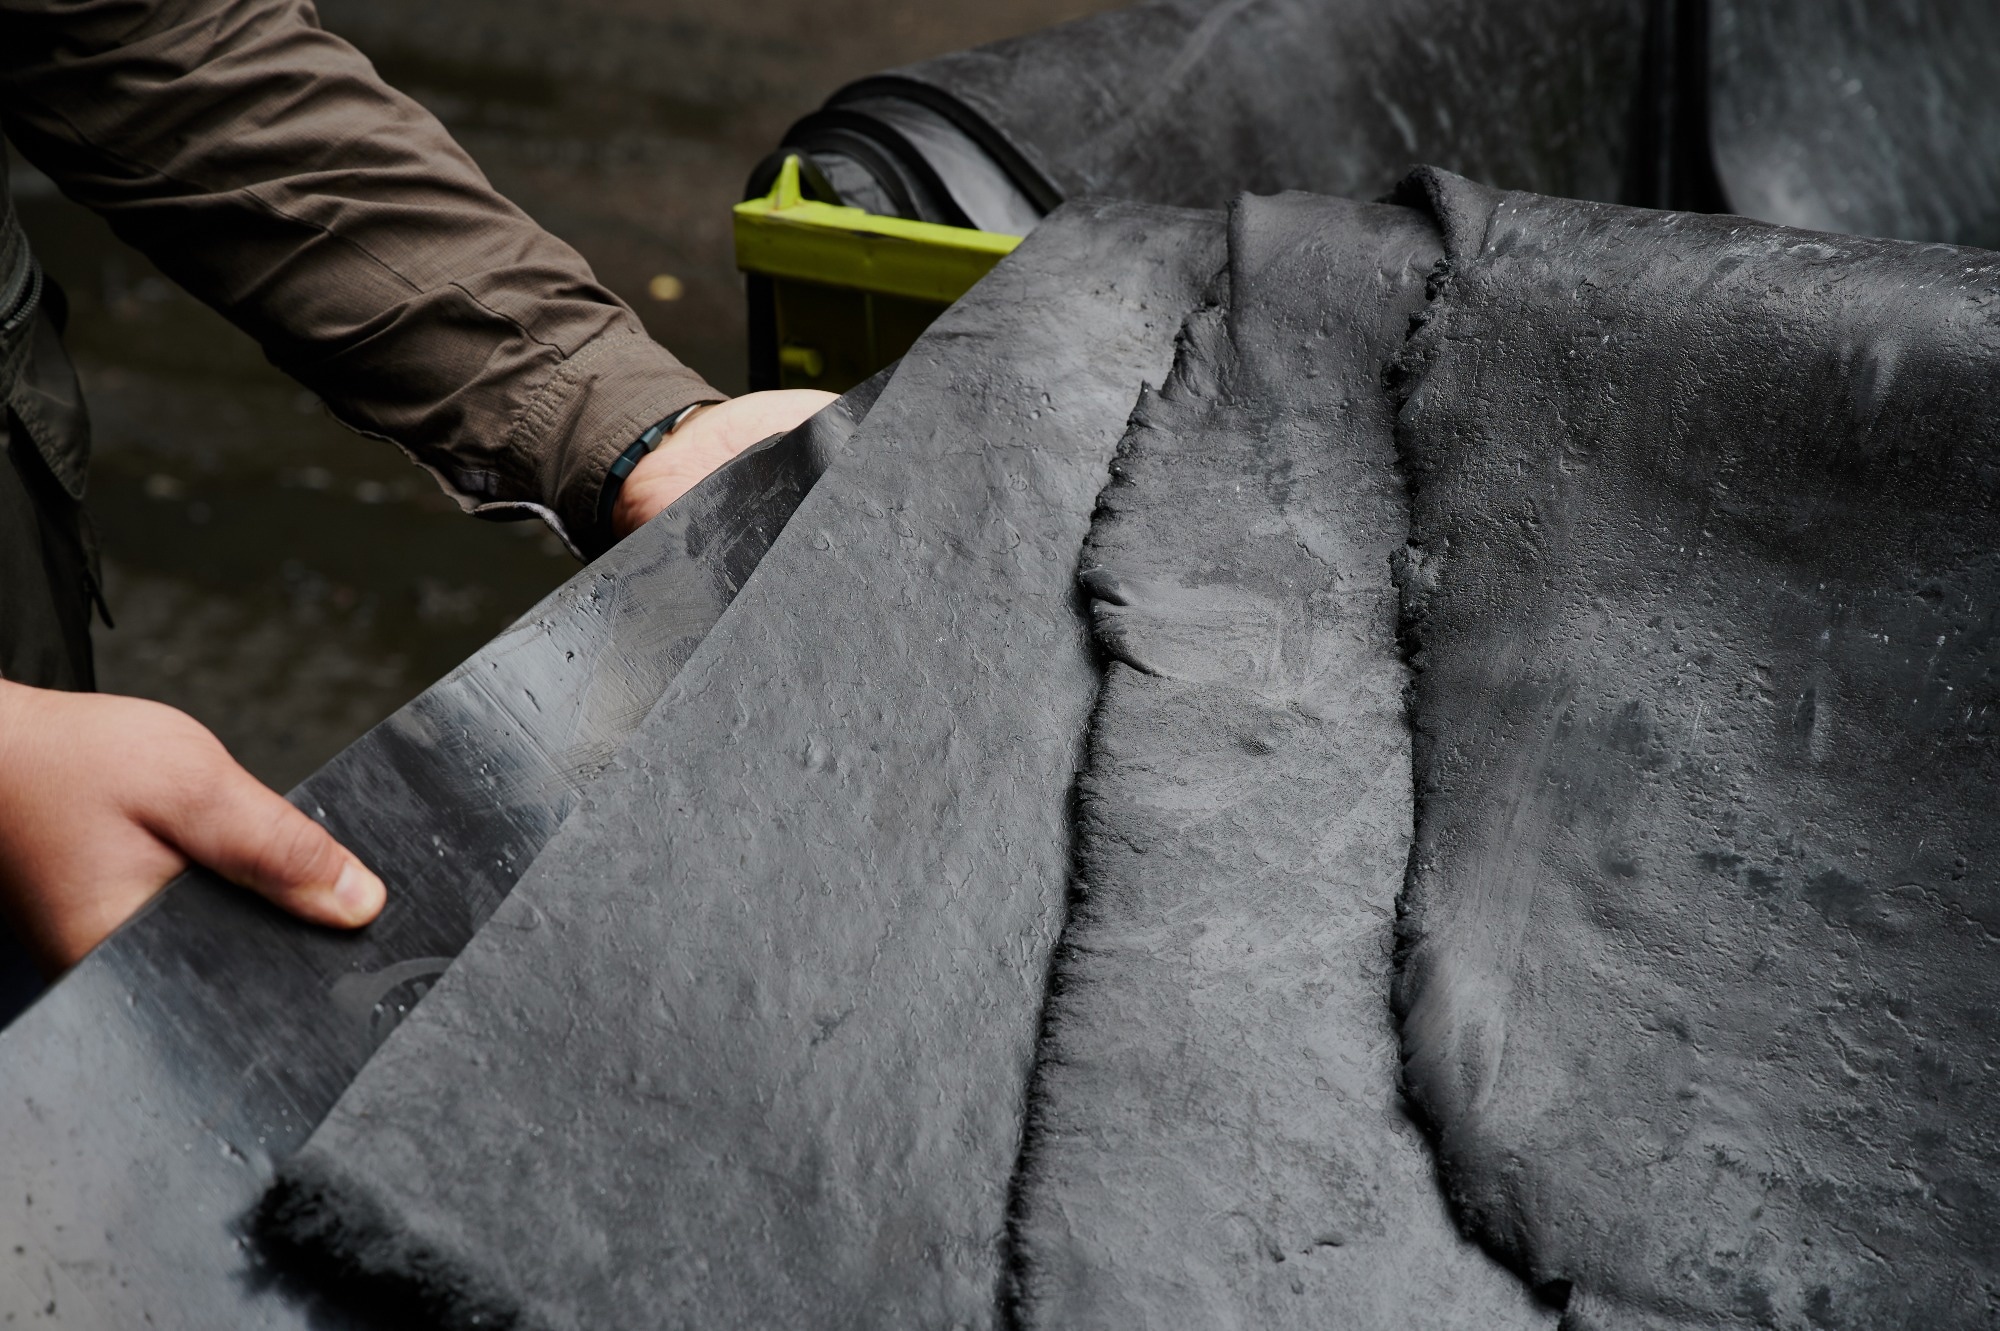
Image Credit: Akimov Igor/Shutterstock.com
A Challenging Sample to Image
Benhui Yu et al. described their process very accurately and selected a rather challenging sample to validate their workflow. They combined natural rubber with carbon black, other additives, and short polyester fibers in a mixer at a rolling temperature ranging between 40 and 50 Celsius.
The mixing process resulted in a composite polymer made of material with very comparable density (1.4g/cm3 for the polyester fibers vs ~1g/cm3 for the resulting rubber). This poses a challenge for CT scans, as the difference in density among materials is what provides contrast in datasets resulting from this imaging technique.
When imaging such a sample, the scanner’s sensitivity must be increased to distinguish between the two materials in the results. However, the increase in sensitivity comes at a cost in terms of field of view, so the original 3 x 3 x 2.4 mm sample could not be fully scanned. The team, therefore, focused on a subvolume of 1.05 x 1.05 x 1.05 mm.
Converting Images in Actionable Numerical Information
Once the scan is completed, imaging reconstruction software needs to be used. This software converts the scan into a 3D model that can be further investigated.
The reconstruction algorithms have a strong dependency on the operational parameters, so most CT users tend to rely on the software provided with their hardware for the reconstruction.
This is similar to what the team previously did, which involved transferring the data to the image processing software Avizo for visualization, segmentation, and measurement of the fibers in the sample.
The team utilized the software features to remove noise and acquisition artifacts from the dataset, obtaining data that was easier to segment. They then proceeded to identify the polyester fibers using a segmentation algorithm based on image binarization. The result of the algorithm provided the team with a visual representation of the fiber network inside the material.
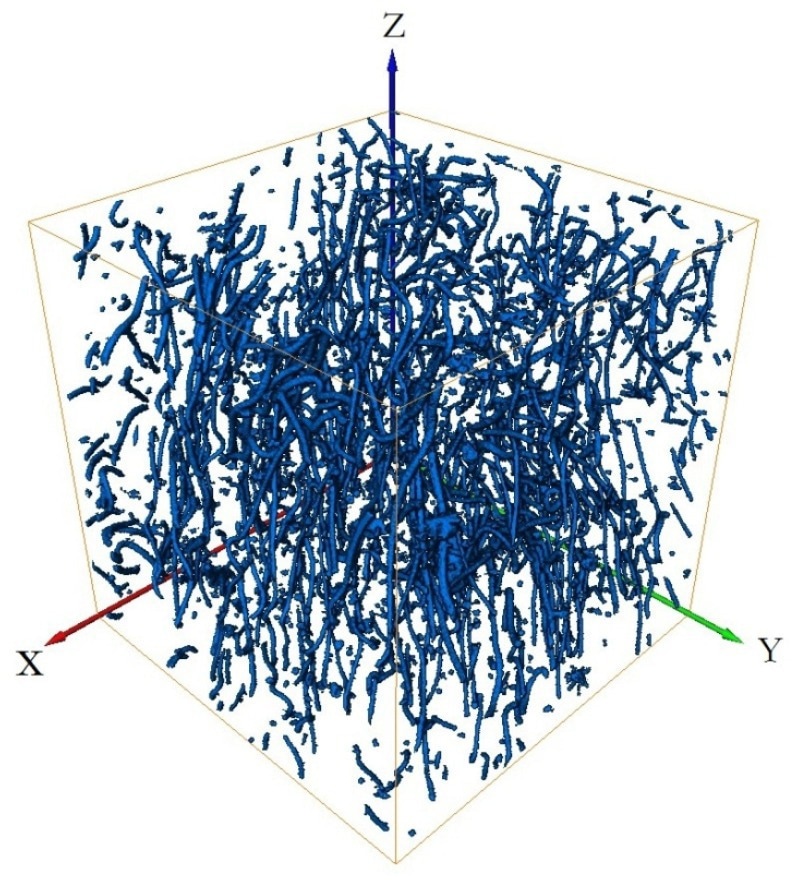
Images of polyester short fibers reconstructed using Thermo Scientific™ Avizo™ Software. Image Credit: https://doi.org/10.3390/ma15103726
Now that the fibers have been identified, the next natural step is correlating the visuals with a numerical output. The team focused on a full characterization approach and used Avizo Software functionalities to measure the number of fibers, their length, and their orientation in space: all properties that help material scientists obtain more accurate mathematical models that describe composite materials behaviors, especially when undergoing shear stress of compression or tension.
Learn more: Introduction to Avizo Software for composite materials characterization webinar
References and Further Reading
Yu, B.; Ren, J.; Wang, K.; Wang, C.; Bian, H. Experimental Study on the Characterization of Orientation of Polyester Short Fibers in Rubber Composites by an X-ray Three-Dimensional Microscope. Materials 2022, 15, 3726. https://doi.org/10.3390/ma15103726