Sponsored by Gatan, Inc.Reviewed by Olivia FrostFeb 3 2023
The VelocityTM Pro is part of the Velocity Series of Electron Backscatter Diffraction (EBSD) sensors. It can gather EBSD data at speeds of up to 2,000 indexed points each second with a beam current of less than 10 nA.
In these analytical circumstances, this adaptable detector can analyze the microstructure of materials with high indexing success rates and orientation accuracy performance.
This article will outline how the Velocity Pro was used in conjunction with the APEX™ Software for EBSD to characterize additively produced (AM) 316 L stainless steel samples.
Results and Discussion
AM materials are of substantial scientific interest from the standpoints of both manufacturing and material characteristics.1 Two separate AM samples were studied in this work utilizing the Velocity Pro, which has an acquisition speed of 2,000 indexed points per second and operates at 20 kV and 10 nA incident beam current.
The AM specimens were laser powder-bed-fusion-fabricated 316 L stainless steel alloys. The two samples were almost the same size and shape. Nonetheless, the build direction differed between the two, with the surface evaluated with EBSD aligned with the AM build direction in one sample (termed the normal direction).
For the other sample, the AM build orientation was aligned with the image’s horizontal X-axis (labeled the transverse build direction). EBSD was utilized to determine changes in observed microstructures based on distinct construction orientations at various length scales.
Initially, the APEX Software Montage function was utilized to characterize the whole sample surface to provide an overview of the microstructures. Montage Large Area Mapping collects an array of EBSD maps at various places over the sample surface using stage control and then stitches the data together for further analysis.
This feature enables large-area characterization of samples, which may be gathered efficiently because of the Velocity cameras’ fast collection rates.
Figure 1 shows combined image quality (IQ) and inverse pole figure (IPF) orientation maps from both the normal and transverse build direction samples.
The IPF map colors each pixel based on its crystallographic orientation, which is linked with the normal direction of the sample inspection surface, whereas the IQ is a greyscale coloring with increasing EBSD pattern quality.
The changes in grain structure and orientation between the two construction directions are obvious. The prominent green coloring in the usual build direction correlates to a 110> crystal direction that is parallel to the construction direction. Pole figures can be used to do an additional examination of the orientation evolution.
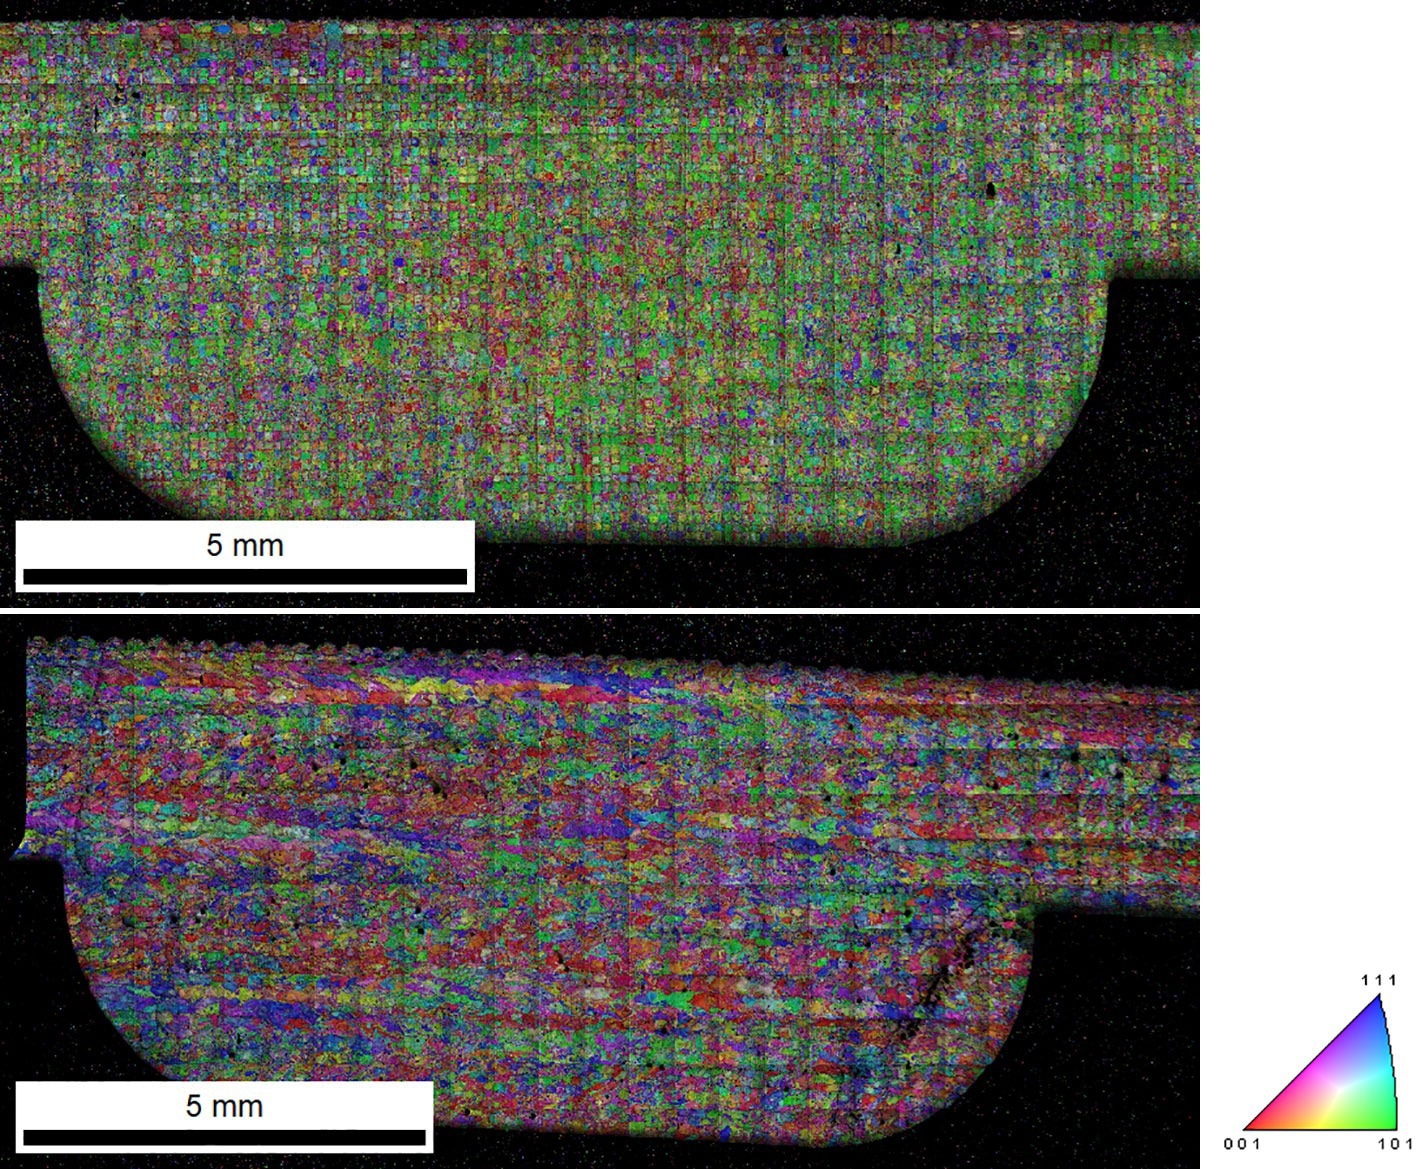
Figure 1. Montage Large Area IQ + IPF orientation maps of the normal (top) and transverse (bottom) build directions. Image Credit: EDAX.
The distribution of chosen crystal orientations compared to the sample reference frame is depicted by pole figures. Figure 2 depicts the pole figures (001), (110), and (111) for both construction directions.
The intensity of the pole figures is calculated using a harmonic series expansion method, with the intensities presented in random multiples of time. The A1 and A2 directions correspond to the vertical and horizontal EBSD map directions, respectively, whereas the center of the pole figures (A3 direction) correlates to the specimen’s normal direction.
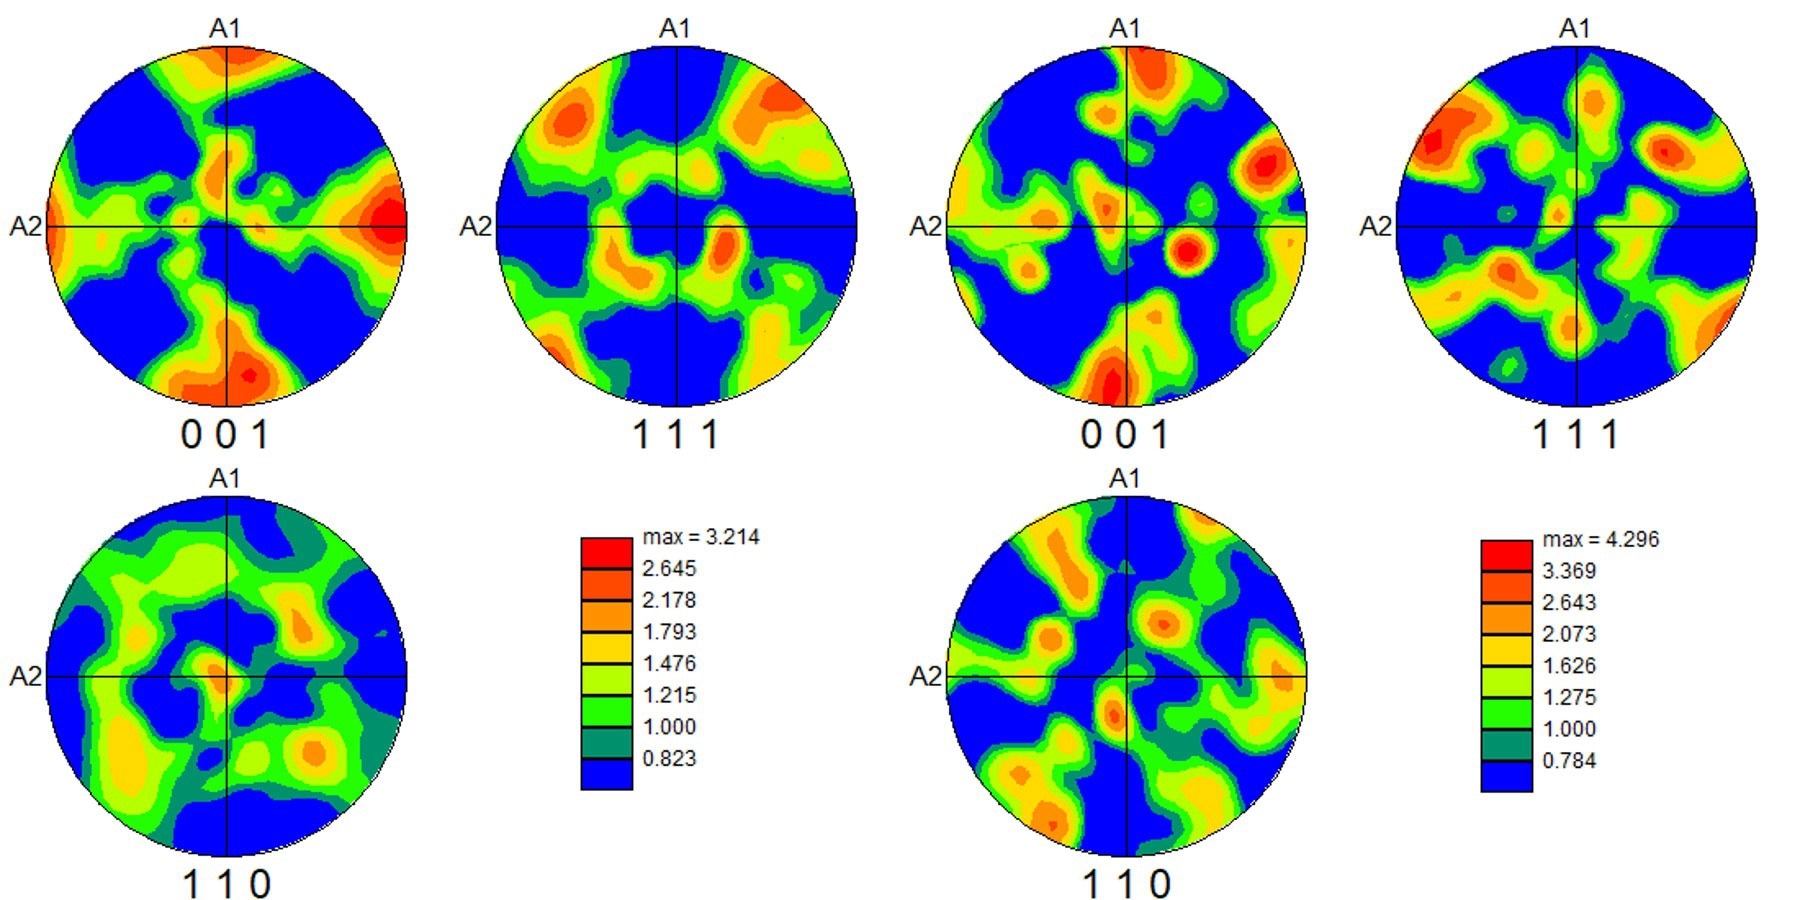
Figure 2. Pole figures for the a) normal and b) transverse build directions. Image Credit: EDAX.
For the normal build direction, the center peak in the (110) pole figure again corresponds with the alignment of the normal direction with the build direction.
The alignment of the peaks in the (001) pole figure with the A1 and A2 sample directions correspond to crystallographic alignment with the deposition laser’s x and y scan direction.
For the transverse build direction, the alignment of the (110) intensity with the A2 sample direction shows a 90° change in the build direction.
Figure 3 depicts the microstructural changes between the two construction approaches. The microstructure is complex in both directions. Non-equilibrium microstructures may be seen in laser powder-bed-fusion samples, and changes in grain morphology reveal that grain shape varies with build direction.
The patchwork pattern of the normal build direction is caused by the 90° rotation of the laser rastering after each AM deposition level. The transverse direction map depicts how the grain structure changes throughout the build layers when the material is repeatedly melted and quickly hardened during the deposition process.
These structures were also subjected to 3D EBSD analysis to better understand how they form.2
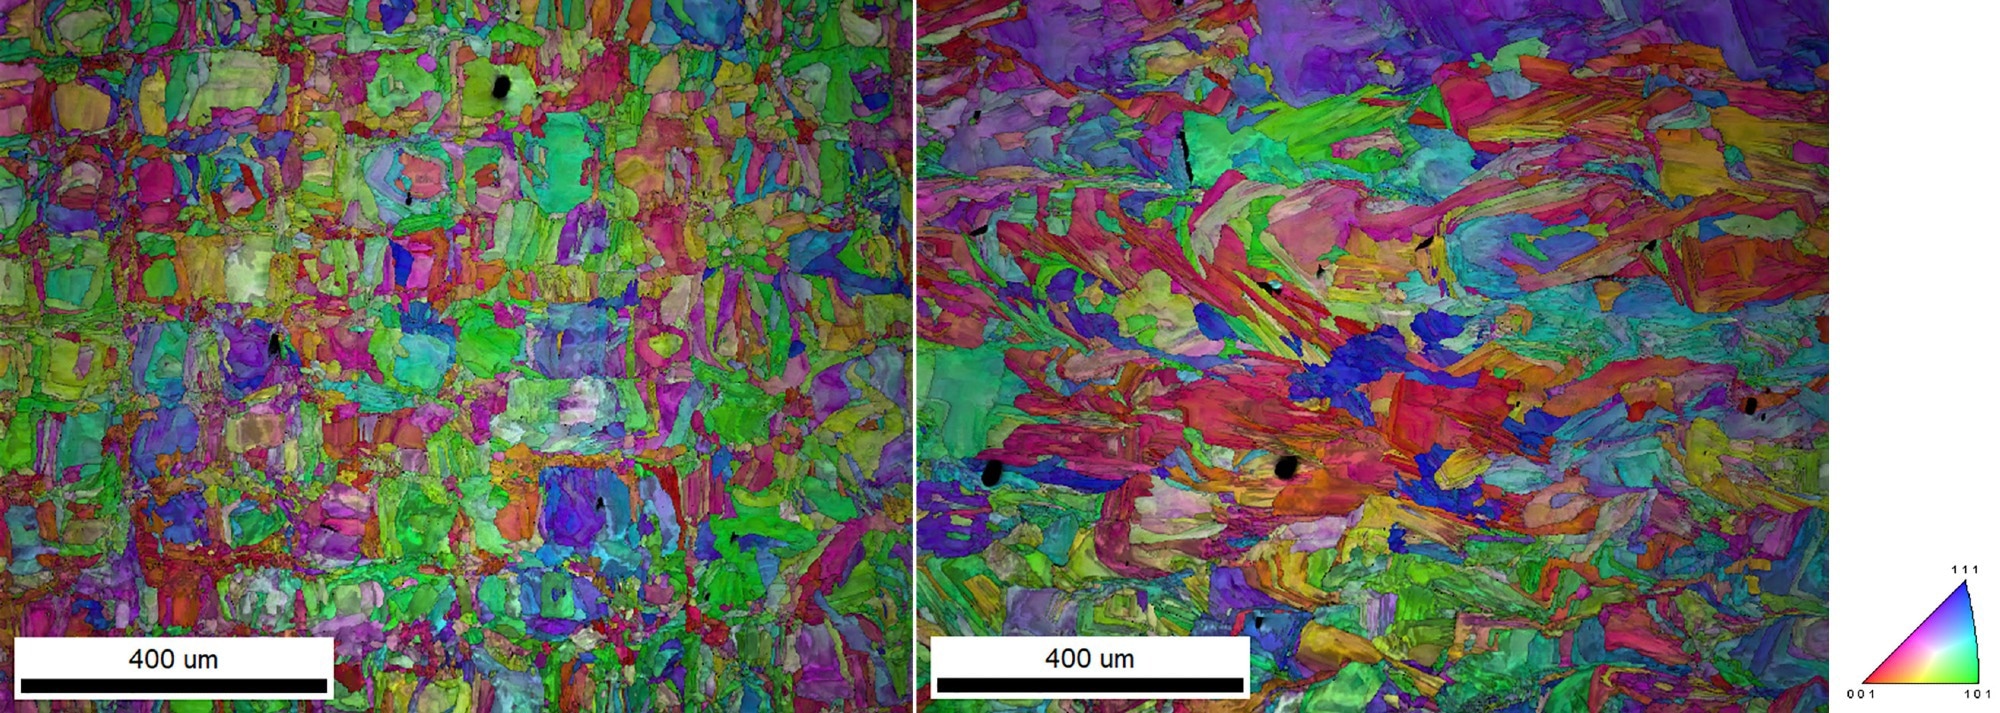
Figure 3. IQ + IPF orientations maps from the normal (left) and transverse (right) build directions. Image Credit: EDAX.
These alloys have substantial residual stresses that may be examined using EBSD and the Velocity Pro. Figure 4 shows a PRIASTM (central ROI) map from both construction orientations.
PRIAS is a novel imaging technique that employs virtual electron detectors as areas of interest (ROIs) established inside the EBSD detector picture. With these images, an ROI was selected within the center of the EBSD detector.
The intensity inside this ROI is captured while the electron beam is rastered over the sample surface and then utilized to build the PRIAS picture. The predominant contrast detected with the central ROI is orientation (channeling) contrast. The intensity fluctuation inside the main grains is substantial in these pictures, indicating a local deformation structure.
Grain boundary overlays may be applied to these photos to differentiate various misorientations and specific grain boundary kinds. Other PRIAS ROIs may be used to demonstrate phase/atomic number disparities and topography contrasts.
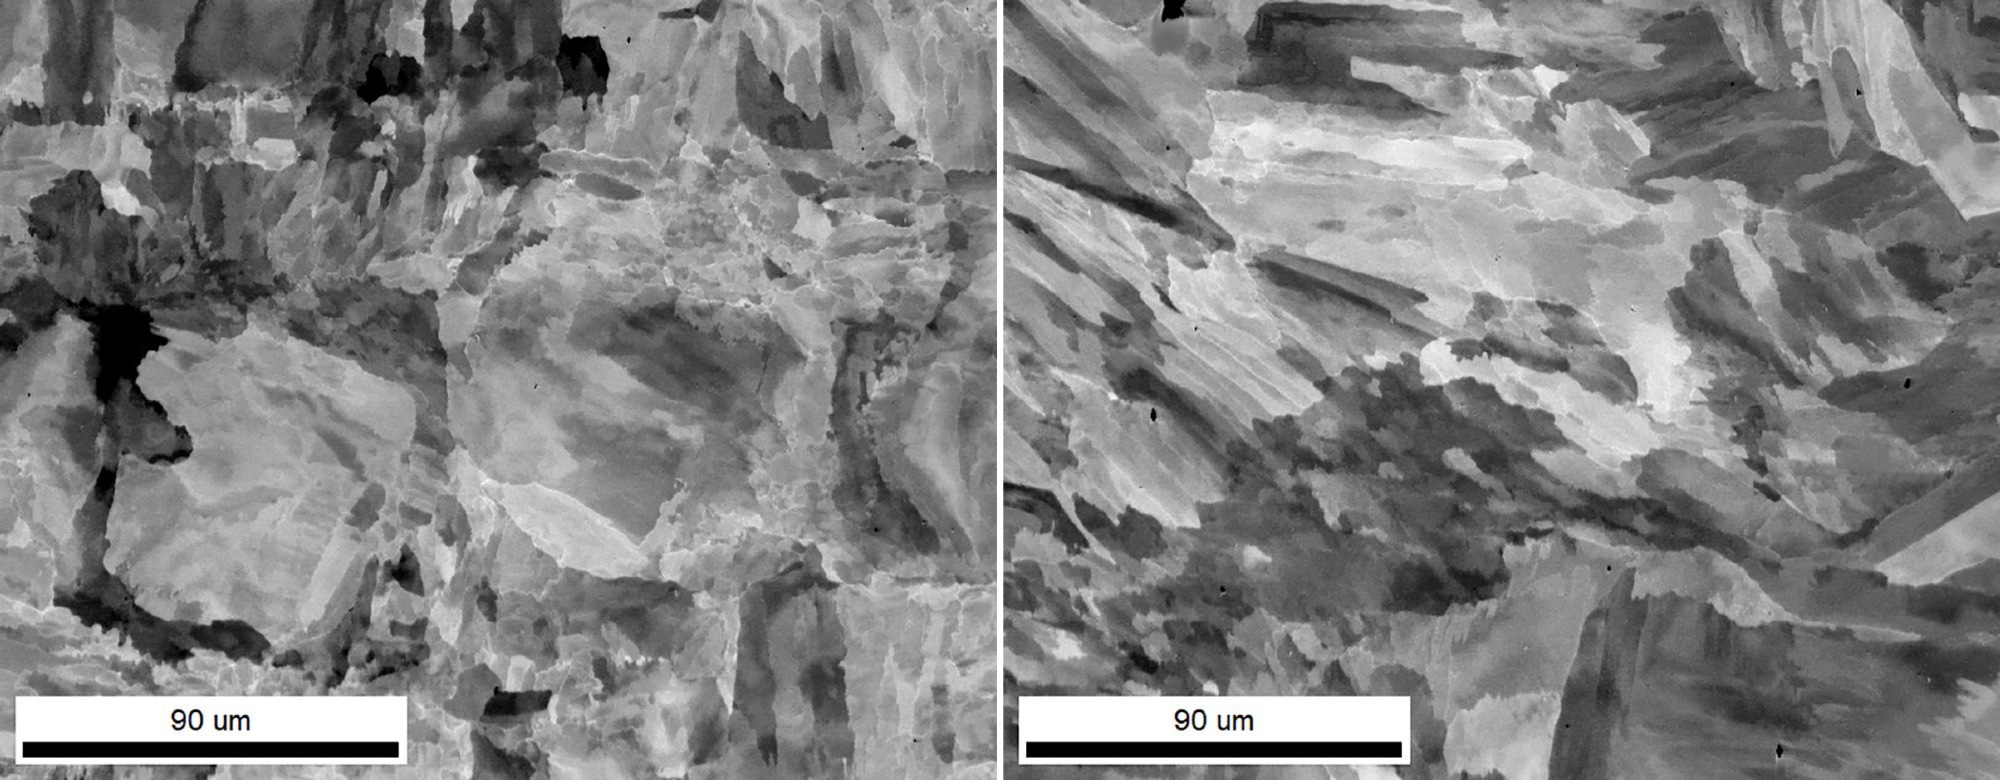
Figure 4. PRIAS (center ROI) maps from the normal (left), and transverse (right) build directions. Image Credit: EDAX.
Misorientations in the microstructure can be seen in many ways.3 Local Orientation Spread (LOS) maps for both construction directions are shown in Figure 5. The misorientation of each pixel in a LOS map is computed relative to a kernel of nearby pixels, with a third nearest-neighbor kernel utilized for these pictures, and the resultant LOS values are colored based on the scale given.
With this method, the grain structure and internal subgrain structure may be viewed. Velocity detectors can attain precisions of less than 0.1° in misorientation. The ability to describe this residual deformation is crucial because it alters the material structure-property connections.
Geometrically required dislocations may also be determined with greater sensitivity utilizing cross-correlation-based high-angular resolution EBSD analysis.
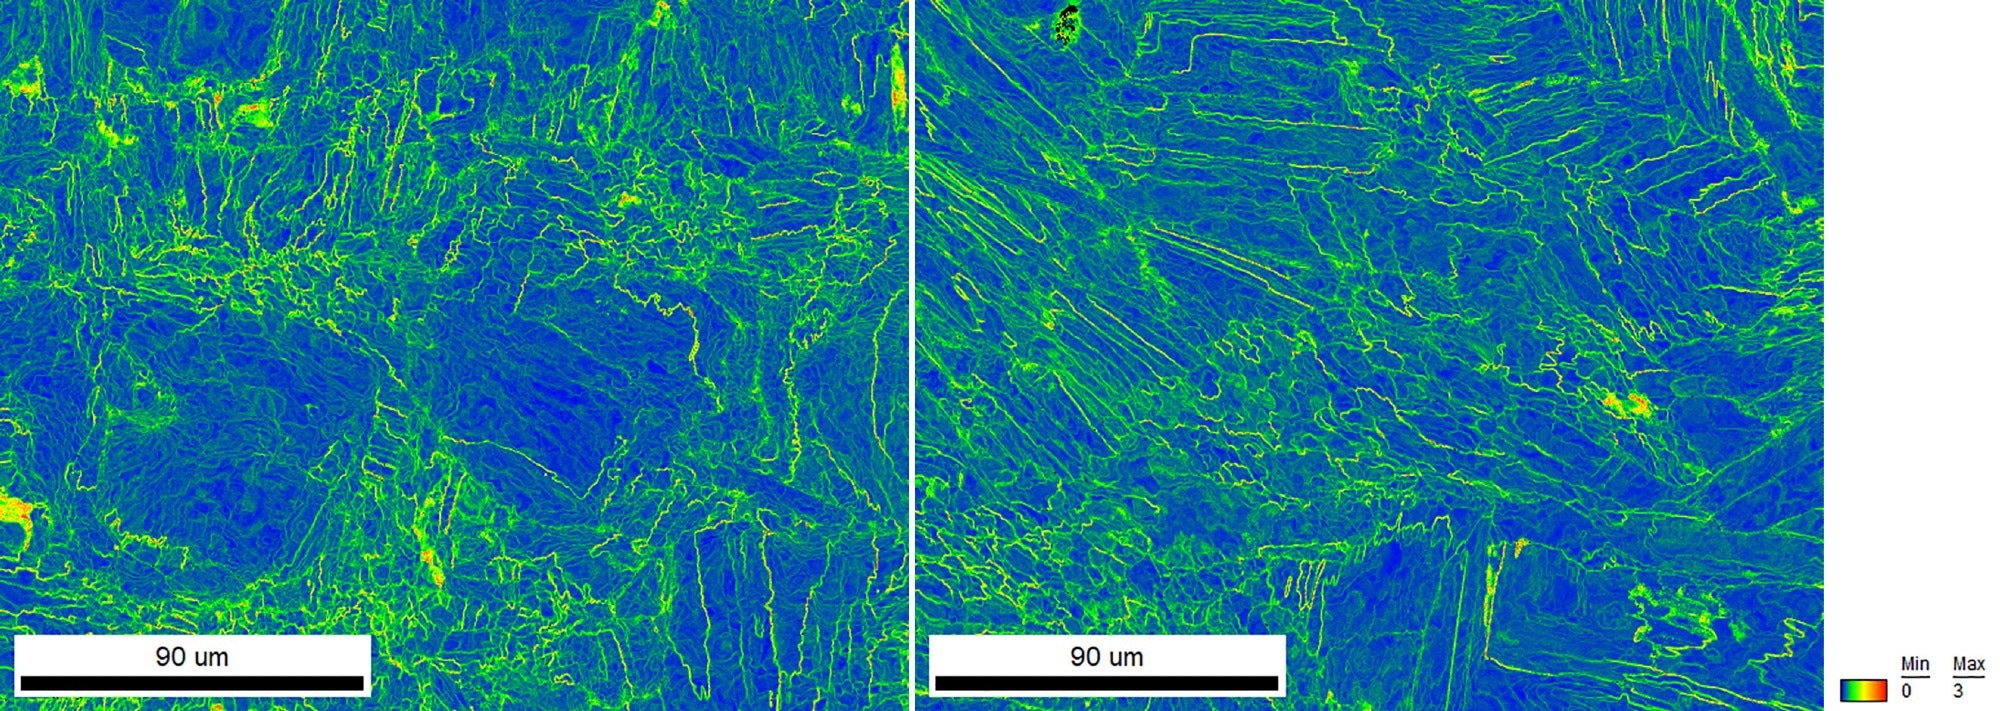
Figure 5. Third nearest-neighbor LOS maps from the normal (left) and transverse (right) build directions. Image Credit: EDAX.
Conclusion
These findings demonstrate how the Velocity Pro may be used to describe the microstructures of additively created materials in a timely and precise manner.
The orientation, grain boundary structure, grain morphology, and local deformation may all be monitored and shown to offer insight into how the AM processing factors impact the final microstructure and material characteristics.
Acknowledgments
EDAX would like to thank Thomas Voisin at Lawrence Livermore National Laboratory for providing the AM samples.
References
- T. Voisin et al., New insights on cellular structures strengthening mechanisms and thermal stability of an austenitic stainless steel fabricated by laser powder-bed-fusion. Acta Materialia 203 (2021) 116476.
- D. J. Rowenhorst et al., Characterization of Microstructure in Additively Manufactured 316L using Automated Serial Sectioning. Current Opinion in Solid State and Materials Science 24 (2020) 100819
- S.I. Wright et al., A Review of Strain Analysis Using Electron Backscatter Diffraction. Microsc. Microanal. 17 (2011) 316-329.

This information has been sourced, reviewed and adapted from materials provided by Gatan Inc.
For more information on this source, please visit Gatan Inc.