Sponsored by EDAXFeb 3 2023Reviewed by Olivia Frost
The role of solidification in the development of material properties and microstructures is becoming more vital as processing techniques that involve solidification, such as additive manufacturing, are becoming more prevalent.
The study outlined in this article, based on a paper by Ezemenaka and Genau (Journal of Crystal Growth 577 (2022) 126389), used Energy Dispersive Spectroscopy (EDS) and Electron Backscatter Diffraction (EBSD) to investigate an AI-Cu-Mg alloy processed through directional solidification.
The results showed that the solidification rate and temperature affected the alloy’s microstructure and composition.
Results and Discussion
The study used a Bridgman-type furnace to directionally solidify eutectic composition (Al – 15.5 at% Cu – 10.6 at% Mg) alloy samples, which were melted in an electric furnace. The solidification conditions were controlled to achieve a stable microstructural growth pattern.
The study analyzed transverse sections parallel to the solidification direction of a sample with 49 mm growth height using EBSD. These sections were prepared by mechanical polishing down to 0.1 µm diamond paste, followed by 2 hours of refining with 0.05 µm colloidal silica on a vibratory polisher.
Final EBSD sample preparation was done using Gatan’s PECS™ II Broad Beam Ion Polisher, alongside a two-step milling routine, 4 kV beam for 10 minutes and 2 kV beam for 60 minutes.
EBSD data was collected using Clarity™ Direct Detector operating at 20 kV acceleration voltage and 1 nA beam, while EDS data was collected using Octane Elite Detector. The microstructure is visualized by the three PRIAS™ images shown in Figure 1.
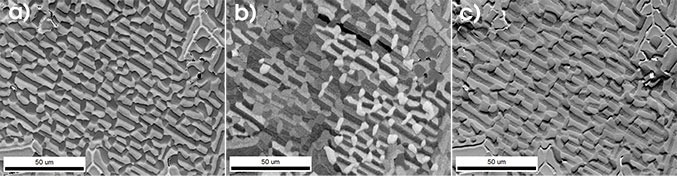
Figure 1. a) PRIAS top ROI image showing atomic number contrast, b) PRIAS middle ROI image showing orientation contrast, and c) PRIAS bottom ROI image showing topographic contrast for the directionally solidified Al-Cu-Mg alloy. Image Credit: EDAX.
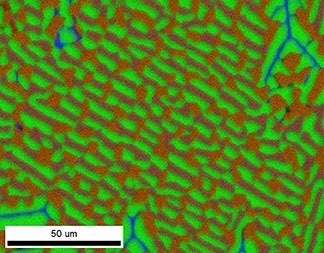
Figure 2. Composite EDS RGB map where the red channel corresponds to the copper signal, the green channel corresponds to the aluminum signal, and the blue channel corresponds to the magnesium signal. Image Credit: EDAX.
Figure 1a shows the atomic number contrast from the top region of interest (ROI) of the sample. Figure 1b shows the center ROI PRIAS image, which displays orientation contrast from different grains and phases in the sample.
Figure 1c depicts the bottom ROI PRIAS image, which highlights the surface topography of the sample caused by the differential polishing rates of its constituent phases.
This multi-phase sample exhibits surface topography as a result of the differential polishing rates of the constituent phases.
As shown in Figure 3, the EDS information was used for ChI-Scan™ analysis for the most accurate and efficient phase mapping. NPAR™ was applied to improve the signal-to-noise ratio.
The phase map depicts the normal two-lamellar/one-rod pattern in this ternary eutectic alloy. The lamellar phases are formed by the aluminum and Al2CuMg phases, whereas the rod phase is formed by the Al2Cu phase.
This EBSD data makes it simple to determine the grain size and morphology of each phase. A cored Al-Si-Mg phase was also discovered, which was caused by contamination from an unknown source.
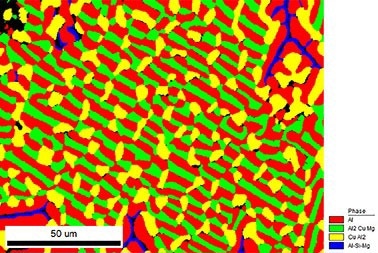
Figure 3. Phase map of the ternary eutectic Al-Cu-Mg alloy measured using combined EDS-EBSD data via ChI-Scan analysis. Image Credit: EDAX.
Figure 4 shows IPF maps of the aluminum, Al2CuMg, and Al2Cu phases, with orientations colored relative to the normal direction of the analysis surface.
The analysis in Figure 4 shows that [001] of the aluminum phase is parallel to [001] of Al2Cu and [100] of the Al2CuMg phase, indicating similar orientations among the phases.
These orientation relationships can be visualized by plotting the colored orientations in inverse pole figures for each phase, as shown in Figure 5.
By comparing Figures 3 and 4, it can be seen that the aluminum grains adjacent to the cored Al-Si-Mg phase have deviating orientations from the other grains and expected relationships.
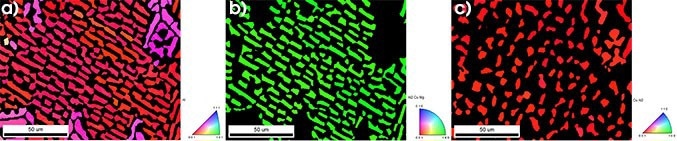
Figure 4. IPF orientation maps for the a) aluminum, b) Al2CuMg, and c) Al2Cu phases, with the orientations colored relative to the surface normal direction of the measured surface. Image Credit: EDAX.
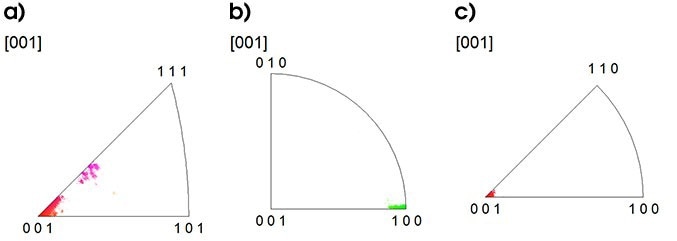
Figure 5. IPF plots for the a) aluminum, b) Al2CuMg, and c) Al2Cu phases, with the orientations colored using the same color scheme from Figure 4. Image Credit: EDAX.
Conclusion
This article demonstrates how combined EDS and EBSD can be used to fully characterize the orientations and orientation relationships present in a complex ternary eutectic alloy prepared by directional solidification.
Clarity, Octane Elite, ChI-Scan, and NPAR can be used to optimize EBSD pattern indexing for accurate results of each phase present in a complex ternary eutectic alloy prepared by directional solidification.
The authors acknowledge permission given by Dominic Ezemenaka for the use of the data.

This information has been sourced, reviewed and adapted from materials provided by EDAX.
For more information on this source, please visit EDAX.