Plastic materials can be found in practically every aspect of everyday life, including packaged foods, furniture, construction materials, vehicles, medical devices, and personal garments (to name a few).1
Plastics are typically composed of synthetic polymers consisting of smaller molecules bonded together in a repeating structure and are recognized for being lightweight, durable, flexible, robust, and (typically) translucent, as well as chemical- and corrosion-resistant.2
Plastics can be easily manufactured and molded into various designs and configurations, making them the ideal material for a vast array of applications.
To manufacture these routine consumer products, polymers are processed at heightened temperatures in a molten form, known as polymer melts. Recognizing how molten polymers flow and deform is essential for efficiently developing specific end products.3
Nowadays, melt flow index (MFI), also known as melt index (MI) or melt flow rate (MFR), is extensively used to quantify polymer flow behavior.
MFI is a measurement of the ease at which a molten polymer will flow under pressure and is described as the weight of material that flows through a capillary die in ten minutes (stated in units of g/10 minutes, but it is often shown unitless).4
Hence, the melt index is inversely related to polymer viscosity, so a high melt index corresponds to a low melt viscosity and vice versa. Even though melt indexing has become a staple in polymer quality control laboratories, it is still a relatively restricted technology.
The issue is that melt index is a single-point viscosity measurement performed at one temperature using a comparatively small shear rate (typically 1 to 100 s-1, although this is highly material- and instrument-dependent), and MFI is frequently measured under conditions that are considerably different from the actual processing conditions.4
In addition, polymer melt viscosity is significantly influenced by shear rate, which can change by orders of magnitude throughout an extrusion operation. In particular, the MFI test is unable to precisely measure polymer branching or account for minor variations in molecular weight distribution.
Rotational shear rheometers, on the other hand, make it possible to investigate polymer flow in greater detail. Polymer melts are non-Newtonian fluids with viscosities that are very sensitive to shear rate, shear history, and/or temperature history.
Knowing the change in melt viscosity across a range of industrially relevant shear rates and temperatures is crucial for developing polymer processing equipment, calculating process energy usage, and optimizing the overall production process.
For example, polymer extrusion, injection molding, and compression molding are all high shear rate processes, yet the quality of the final product is often determined by low shear rate behavior.
This article will outline how small-amplitude oscillatory shear rheology was used to analyze three separate linear low-density polyethylene (LLDPE) samples with equal melt flow indices and average molecular weights.
The shear rate-dependent viscosity values and viscoelastic behaviors of the LLDPE melts were observed using rheological measurements.
The measured rheological data were then directly connected to the molecular structure of the polymer, including the distribution of molecular weight and long-chain branching, as well as the overall processability of the LLDPE samples.
Experimental
Materials
In this investigation, three linear low-density polyethylene (LLDPE) pellet samples were studied (Table 1). Each LLDPE sample was identical in weight-average molecular mass (Mw) and had approximately equal melt flow indices.
According to the information supplied, the sole difference between the three materials was their total molecular weight distribution, which the supplier categorized as either medium or narrow.
Table 1. Background information for the three examined LLDPE materials. Source: Thermo Fisher Scientific – Materials & Structural Analysis
| Sample |
MFI |
Mw |
MWD |
| LLDPE #1 |
0.920 |
106 |
Medium |
| LLDPE #2 |
0.916 |
106 |
Medium |
| LLDPE #3 |
0.918 |
106 |
Narrow |
Rheometry
The LLDPE samples were measured using a Thermo ScientificTM HAAKETM MARSTM iQ Air Rheometer fitted with electric plate and electric hood temperature control modules.
The rheological measurements were performed using a 20 mm diameter parallel plate geometry (unless otherwise noted) at a set temperature of 190 °C to correspond with the standard MFI testing requirements for polyethylene.5,6
The LLDPE pellets were placed directly into the rheometer and melted into a disk-shaped specimen with a height of 0.75 mm between the top and bottom plates.
Data were mostly collected via oscillation frequency sweep from 100 to 0.1 rad/s using a 0.1% strain. Six data points were gathered per frequency decade, and each data point represented an average of five complete oscillations.
Results
Viscosity Profile
Polymer melts are classified as non-Newtonian fluids and often exhibit shear thinning behavior, in which their viscosity reduces as the shear rate increases.
Typically, non-Newtonian viscosity profiles of dilute and semi-dilute polymer solutions are measured under steady-state rotational shear. However, due to their high elasticity and propensity for edge fracture under large deformations, small amplitude oscillatory shear is the preferred testing method for polymer melts.3
According to the Cox-Merz rule, the complex viscosity (Iη*I) plotted against angular frequency (ω) from an oscillatory frequency sweep measurement is equivalent to the resultant steady-state shear viscosity plotted versus shear rate from a rotational shear measurement.7
The Cox-Merz rule is a valid empirical rule for several polymeric materials. Thus, an oscillatory frequency sweep followed by the application of the Cox-Merz rule is the optimum technique for collecting actual shear viscosity measurements for molten polymers.
Figure 1 depicts the oscillatory frequency sweep response (η* vs. ω) for the three analyzed LLDPE samples. LLDPE #3 demonstrated conventional polymer flow behavior, exhibiting a Newtonian plateau at low frequencies (1 rad/s) and a constant, frequency-independent viscosity.
Later, at frequencies greater than 1 rad/s, LLDPE #3 started to shear thin. The LLDPE #1 and LLDPE #2 samples, on the other hand, exhibited a continual shear thinning trend and never achieved a Newtonian plateau during the studied frequency range.
LLDPE #2 had the lowest viscosity at high frequencies, whereas LLDPE #3 had the highest. At low frequency (0.1 rad/s), however, the reverse trend was observed: LLDPE #2 had the greatest viscosity while LLDPE #3 had the lowest.
In addition, at a frequency of ~1 rad/s, the viscosities of all three LLDPEs were almost identical. The shear-dependent behavior of these three samples demonstrates that the viscosity of complex materials, such as polymer melts, cannot be accurately represented by a single-point measurement and their actual flow behavior is most effectively characterized by a complete viscosity profile.
The shear rate-dependent viscosity information produced from oscillatory frequency sweep studies can be utilized to assess the molecular structure and processability of polymeric materials.
The low-frequency/shear rate data can be utilized to evaluate molecular weight (Mw) of the polymer melt, while the low-to-medium frequency/shear rate data is indicative of the molecular weight distribution (MWD) .
In contrast, medium-to-high frequency/shear rate data can be utilized to assess the flow resistance of material during typical polymer processing applications, including compression molding (~0.01 to 10 rad/s), extrusion (~10 to 1000 rad/s), and blow or injection molding (>1000 rad/s).
While not utilized here, the Time-Temperature Superposition (TTS) approach can be employed to examine rheological behavior across a broader frequency range, and it is particularly useful when attempting to acquire viscosity data at high frequencies/shear rates (>100 rad/second) in a rotational shear rheometer.3
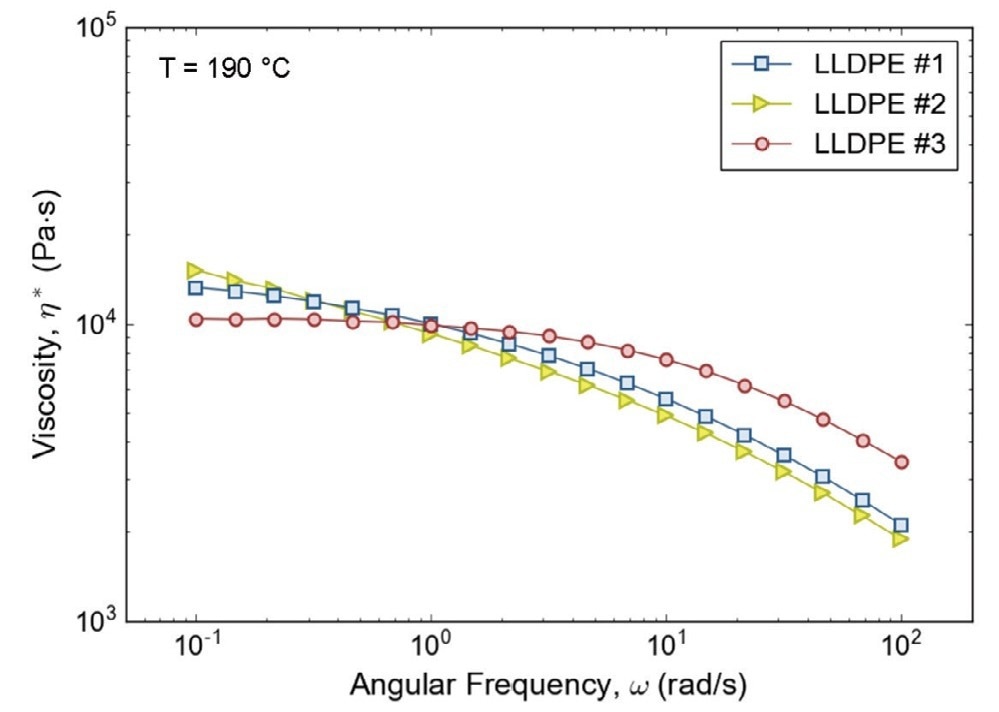
Figure 1: Complex viscosity as a function of angular frequency for LLDPE #1 (squares), #2 (triangles), and #3 (circles). Image Credit: Thermo Fisher Scientific – Materials & Structural Analysis
At process-relevant shear rates (>10 rad/s), the viscosity of the LLDPE #3 sample is greater than that of the other two LLDPE samples (Figure 1).
Consequently, the LLDPE #3 material would be more challenging and energy-intensive to manufacture, resulting in increased equipment wear (increasing capital and operating costs and leading to additional process downtime).
In addition, polymers such as LLDPE #3 often need a "processing aid" to minimize back pressure and melt viscosity in order to reduce operating costs and to make the extrusion process more cost-effective.
In comparison, the decreased viscosity of LLDPE #1 and LLDPE #2 would make them easier to process without the need for extra additives or processing adjustments.
Molecular Weight
Molecular weight is a crucial material parameter for defining a polymer's flow behavior at increased temperatures, and relatively minor variations in average molecular weight may result in substantial variations in apparent viscosity.8
Polymer melt viscosity is typically constant at low frequencies/shear rates, as displayed by LLDPE #3 in Figure 1. The constant viscosity in this low frequency/shear region is known as the zero-shear or Newtonian plateau viscosity.
The zero-shear viscosity, η0, is directly related to the weight-average molecular weight (Mw) of a polymer melt; the higher the molecular weight, the higher the zero-shear viscosity (and vice versa).
The three LLDPE samples examined here were stated to have equal average molecular weights and therefore, one would anticipate them to have comparable zero-shear viscosities.
Nevertheless, samples LLDPE #1 and LLDPE #2 did not show a Newtonian plateau within the applied frequency range, and their viscosity increased consistently with decreasing frequency/shear.
In addition, if the LLDPE #1 and LLDPE #2 materials exhibited Newtonian behavior at frequencies outside the reported range, their zero-shear viscosity would be much greater than that of the LLDPE #3 sample, indicating that they had a significantly higher average molecular weight.
Yet, an apparent viscosity that is more rate dependent at low frequency/shear can imply a widened molecular weight distribution and/or polymer long-chain branching.
Molecular Weight Distribution
For a fixed molecular weight, the energy needed to process a polymer is proportional to its viscosity shear rate dependency (i.e., shear thinning behavior).
The start and the magnitude of shear thinning varies between materials and corresponds qualitatively with molecular weight distribution: Polymers with a broad distribution tend to thin more at lower shear rates than those with a narrow distribution with the same average Mw.
For material handling, shear thinning is regarded as the most significant non-Newtonian polymer feature since it improves material flow and minimizes heat production and energy consumption during processing.
Increasing the molecular weight distribution of a polymer, for instance, can facilitate molding and extrusion operations. Conversely, a molecular weight distribution that is excessively wide can have detrimental effects on product quality, such as heightened blown film haze or elevated surface roughness during molding.
In addition, high molecular weight components may contribute to undesirable gelled areas during film production, and an extremely wide MWD can result in non-uniform relaxation during cooling, which can lead to post-extrusion die swelling or warpage during injection molding.
Based on the observed shear thinning behavior, the apparent molecular weight distributions of the LLDPE materials investigated here would be as follows (from thinnest to widest): LLDPE #3 < LLDPE #1 < LLDPE #2.
The LLDPE #3 exhibited a substantially narrower distribution as a result of its flatter viscosity profile and delayed shear thinning behavior.
The LLDPE #1 and LLDPE #2 samples, on the other hand, displayed comparable shear thinning behavior and as a result, seem to have comparable MWDs, which is consistent with the supplier's material data (Table 1).
In general, LLDPE #1 and LLDPE #2 materials are expected to be simpler and less energy-intensive to process than LLDPE #3.
Long-Chain Branching
Along the primary polymer backbone, the length, amount, and distribution of polymer branches can vary. Adjusting the quantity, length, and/or flexibility of the branches can have a considerable effect on the melt's rheology.9
If the branches are long enough, branched polymers can entangle, and these entanglements will result in a higher melt viscosity at low frequency/shear values than their linear or less branched counterparts.10
In addition, long-chain branching can increase the elasticity of a polymer, as shown by the observed storage modulus (G') and the normal stress response.
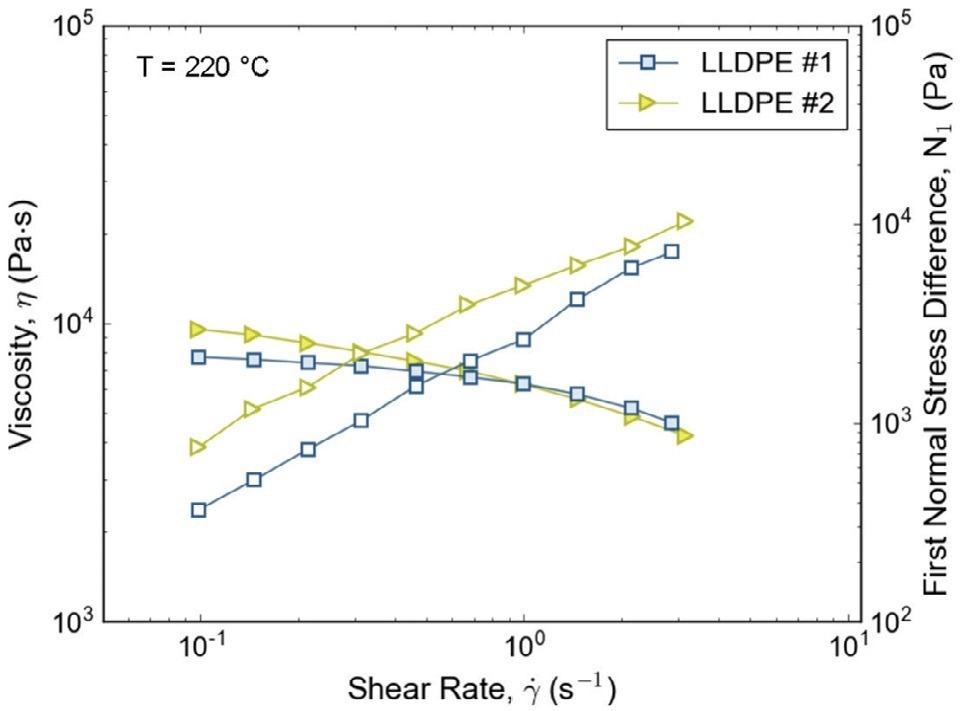
Figure 2: Viscosity (left y-axis; filled symbols) and first normal stress difference (right y-axis; open symbols) as a function of shear rate for LLDPE #1 (squares) and #2 (triangles). Image Credit: Thermo Fisher Scientific – Materials & Structural Analysis
The first normal stress difference, which may be quantified using a cone-and-plate geometry under constant rotational shear, is a commonly used metric for evaluating polymer long-chain branching.11
Figure 2 shows the observed steady-shear viscosities as a function of shear rate for the LLDPE #2 and LLDPE #1 samples (determined using a 35 mm diameter, 1° cone geometry).
Note that the data in Figure 2 was obtained at 220 °C to facilitate sample loading (all other data was taken at 190 °C); nonetheless, the reported trends should be consistent regardless of the measurement temperature.
Similar to their observed behaviors under oscillatory shear, both samples exhibited continuous shear thinning at low shear rates (<1 s-1), with the LLDPE #2 sample exhibiting a higher low-shear viscosity.
Respectively, the first normal stress difference, N1 (Figure 2; displayed on the right y-axis) was also considerably greater for LLDPE #2.
The increased low-shear viscosity and enhanced normal stress response shown by LLDPE #2 in comparison to LLDPE #1 implies that sample #2 had increased long-chain branching (either in number or length).
Normal stress behavior can be connected to the elastic response of linear and branched polymers, and it can also be directly coupled to processing behavior . For instance, long chain branching may increase die swelling during extrusion and may cause increased film thickness during blow molding.
Viscoelasticity
In addition to complex viscosity, oscillatory shear measurements also quantify of a polymer’s viscous and elastic characteristics, referred to as viscoelasticity.. The storage and loss moduli (G' and G", respectively) describe the elastic and viscous behavior of a substance.
The molecular structure, as well as the testing/processing conditions of a polymer, will determine which behavior is dominant: viscous or elastic.
For instance, too much elasticity can lead to flow anomalies and unwanted effects during processing, such as die swell, sharkskin, or melt fracture (to name a few).3, 12 Understanding the viscoelastic properties of a given polymeric material is critical for adjusting product formulations and blends and for optimizing processing conditions.
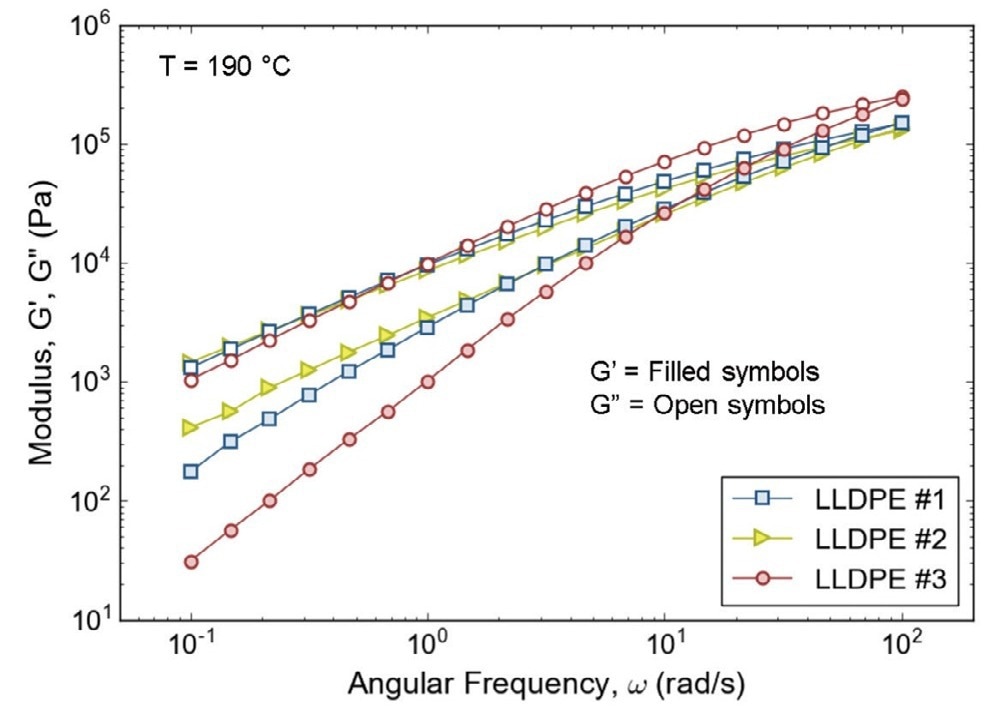
Figure 3: Storage modulus, G’ (filled symbols) and loss modulus, G” (open symbols) as a function of angular frequency for LLDPE #1 (squares), #2 (triangles), and #3 (circles). Image Credit: Thermo Fisher Scientific – Materials & Structural Analysis
When measured across a range of frequencies or time scales, oscillatory shear measurements can offer information on the molecular weight (Mw) and molecular weight distribution (MWD) of a material, as well as its structure and overall physical state.
G' and G" are shown as a function of angular frequency for the three examined LLDPE materials in Figure 3. The crossover point (where G' = G") corresponds directly with the Mw and the MWD of a polymer melt; changes in the crossover frequency imply changes in Mw, whereas changes in crossover modulus suggest changes in MWD.
The three examined materials exhibit a crossover at the same frequency value, indicating that their weight-average Mw values are comparable.
Nevertheless, LLDPE #3 exhibits a crossover at a higher modulus value, indicating a narrower MWD, while LLDPE #2 and LLDPE #1 exhibit crossovers at comparable moduli, indicating comparable but larger MWDs than LLDPE #3.
The difference between G' and G" at low frequencies (<1 rad/s) also correlates to MWD. The greater the MWD, the closer G' and G" are together, and vice versa. Applying this principle, LLDPE #3 once again exhibits a lower MWD, whereas LLDPE #2 exhibits a somewhat wider MWD than LLDPE #1.
The size of the crossover modulus and the modulus difference at low frequencies support the MWD results derived from the viscosity profiles in Figure 1.
As stated previously, polymer melt elasticity (G') is a crucial element in defining viscoelastic melt behavior and may be the source of several flow abnormalities. During processing, excessive elasticity, as measured by G' at low frequencies, can reduce product quality.
LLDPE #3 had the lowest G' values, whereas LLDPE #2 exhibited the greatest elasticity.
While LLDPE #1 and LLDPE #2 could be simpler to process because of their lower viscosities, their greater elasticity may render them more susceptible to surface flaws, such as die swelling and melt fracture, during extrusion and/or warpage during molding.
Conclusions
The flow behavior of polymer melts is complicated and it is highly dependent on shear rate and temperature and cannot be adequately represented by a simple viscosity measurement such as melt flow index.
In contrast, rheology is a robust analytical technique that not only evaluates the flow behavior of polymeric melts but also provides information on molecular structure, processing behavior, and end-product quality.
The three LLDPE samples examined in this article exhibited similar melt flow indices and average molecular weights. Yet, all three samples exhibited distinctive rheological properties, including differing viscosities at low shear, discrete shear thinning profiles, and contrasting degrees of elasticity.
The viscosity profiles and viscoelastic response of the examined LLDPEs were used to identify clear differences in molecular weight distribution, as well as detect the presence of long-chain branching.
Understanding the variation in melt viscosity and viscoelastic behavior over a range of industrial-relevant shear rates is crucial to the design of polymer processing equipment, determining process energy consumption, and overall process optimization.

Image Credit: Thermo Fisher Scientific – Materials & Structural Analysis
References
- Andrady AL, Neal MA. Applications and societal benefits of plastics. Philos Trans R Soc Lond B Biol Sci. 2009 Jul 27;364(1526):1977–84. doi: 10.1098/ rstb.2008.0304. PMID: 19528050; PMCID: PMC2873019.
- NATURE COMMUNICATIONS, The Future of Plastic, (2018) 9:2157, NATURE COMMUNICATIONS | (2018) 9:2157 |DOI: 10.1038/s41467-018-04565-2 | www.nature.com/naturecommunications.
- F. Meyer and N. Crawford. Optimizing process conditions and ensuring end product requirements of plastics with rheological analysis, Thermo Fisher Scientific Application Note AN52341 (2018).
- A. V. Shenoy, S. Chattopadhyay, and V. M. Nadkarni. From melt flow index to rheogram. Rheol. Acta 22, 90–101 (1983)
- ASTM D1238-20, Standard Test Method for Melt Flow Rates of Thermoplastics by Extrusion Plastometer, ASTM International, West Conshohocken, PA, 2020, www.astm.org (DOI: 10.1520/D1238-20).
- ISO 1133-1:2011, Plastics - Determination of the melt mass-flow rate (MFR) and melt volume-flow rate (MVR) of thermoplastics - Part 1: Standard method, ICS : 83.080.20, 2011.
- W.P. Cox and E.H. Merz. Correlation of dynamic and steady flow viscosities. Journal of Polymer Science, 28, 619 (1958)
- Helmut Munstedt. Rheological properties and molecular structure of polymer melts. Soft Matter, 2011, 7, 2273–2283, DOI: 10.1039/c0sm00891e.
- Paula M. Wood-Adams and John M. Dealy. Effect of Molecular Structure on the Linear Viscoelastic Behavior of Polyethylene. Macromolecules 2000, 33, 7489–7499, DOI: 10.1021/ma991533z.
- F Snijkers, R Pasquino, P D Olmsted, and D Vlassopoulos. Perspectives on the viscoelasticity and flow behavior of entangled linear and branched polymers. J. Phys.: Condens. Matter 27 (2015) 473002 (13pp), DOI:10.1088/0953-8984/27/47/473002.
- Changping Sui and Gregory B. McKenna. Instability of entangled polymers in cone and plate Rheometry. Rheol Acta (2007) 46:877–888, DOI 10.1007/ s00397-007-0169-8.
- C.W. Macosko, Rheology: Principles, Measurements and Applications, VCH, New York, 1994.

This information has been sourced, reviewed and adapted from materials provided by Thermo Fisher Scientific – Materials & Structural Analysis.
For more information on this source, please visit Thermo Fisher Scientific – Materials & Structural Analysis.