Sponsored by PerkinElmerReviewed by Olivia FrostMay 5 2023
Biodiesel, or fatty acid methyl ester (FAME), is a biodegradable and renewable fuel from animal fats, vegetable oils, and recycled cooking oils and greases. These fats comprise triglycerides, a variety of ester derived from glycerol and three fatty acid chains.
Biodiesel is created by reacting the triglyceride with alcohol in transesterification. The resulting biodiesel has ignition and flow properties well-suited to most diesel engines.1
Pure biodiesel (B100) is frequently blended with ultra-low sulfur diesel fuel (ULSD) to produce ratios of 5% (B5), 10% (B10), and 20% (B20) biodiesel in the fuel blend. A rapid and precise test technique is highly attractive as quality control for the producers, blenders, and distributors of diesel fuel.
ASTM D7371 is a standard test method for determining biodiesel content across the 1 – 100%v/v biodiesel concentration range in diesel fuel blends through FTIR spectroscopy with a suitable ATR accessory.2
As the need for renewable fuels is ever-growing, evaluating biodiesel fuel blends remains relevant in today’s energy landscape.
This article describes using the PerkinElmer Spectrum Two™ FTIR Spectrometer in combination with the PIKE Technologies MIRacle 9 bounce diamond/ZnSe ATR accessory to deliver a rugged, precise, and portable analyzer to establish biodiesel content in diesel fuel, according to ASTM D7371.
The calibration models built for this application may be provided as a starter calibration with the potential for fast optimization of an analyzer in the field without requiring complete recalibration.
Instrumentation
Table 1 details the components utilized in this application.
Table 1. Application Components. Source: PerkinElmer
| Description |
PerkinElmer
Part Number |
| Spectrum Two FTIR with APV and DTGS detector |
L160000F |
| Spectrum Two ATR Biodiesel Application Pack |
L1600142 |
The Spectrum Two FTIR had a temperature-stabilized deuterated triglycine sulfate (DTGS) detector. The instrument configuration incorporates a filter wheel with reference material for automated instrument performance verification.
The filter wheel includes a methane cell for the Absolute Virtual Instrument (AVI) calibration. The AVI algorithm standardizes a measured methane spectrum using data from the HITRAN database.3
AVI compensates for the instrument accessory variation that may hinder instrument calibration transfer. AVI enables calibration transfer between instruments to aid the rapid deployment of instruments.4
The MIRacle ATR accessory is straightforward to fit into the Spectrum Two sampling compartment, as displayed in Figure 1. Spectrum IR software automatically recognizes the MIRacle accessory.

Figure 1. Spectrum Two with PIKE MIRacle ATR with 9 bounce top plate fitted. Image Credit: PerkinElmer
Table 2. Source: PerkinElmer
| Scanning Parameters |
| Spectral Range |
4000 – 650 cm-1 |
| Resolution |
4 cm-1 |
| Number of Scans |
8 |
| Ordinate |
Absorbance (AU) |
| AVI |
On |
A triple solvent was utilized to clean the MIRacle ATR, as advised by ASTM D7371. This solvent comprised an equal ratio of methanol, acetone, and toluene.
Before analyzing and collecting the background spectrum, it is crucial to clean the ATR crystal to guarantee that no residual contamination or sample carryover remains before analysis. One drop of triple solvent dispensed using a Pasteur pipette should be adequate to clean the ATR crystal.
Following the solvent being dispensed, any contamination can be removed by gentle cleaning with a cotton swab, and this also assists in drying the ATR crystal. The cleaning procedure must be repeated between sample analyses to avoid sample carryover.
To confirm that no sample carry-over takes place, the Spectrum IR software’s monitor function can be utilized to ensure the crystal is clean between sample analyses.
Calibration
The infrared spectra of biodiesel blends display non-linear behavior concerning concentrations over the 0 – 100 %v/v biodiesel because of interactions between mixture components. As a result, it is not possible to create a single linear calibration model covering the whole range.
ASTM D7371 requires the calibration to be divided into three separate PLS calibration models.2 These are a low calibration model of 0 – 10 %, a medium calibration of 10 – 30 %, and a high calibration of 30 – 100 %v/v biodiesel content.
According to the ASTM D7371 method, three different diesel fuels are used as a standard calibration matrix.
Low cetane, high cetane, and ultra-high cetane index diesel fuel are employed to prepare the calibration standards to model the differences in the cetane index generally present in samples because of seasonal differences in the fuel chemistry.
The spectral pre-processing parameters were set in agreement with ASTM D7371, which specifies spectral ranges to consider for each of the three calibration ranges.
Figure 2 displays an overlay of the standards for preparing the low calibration model following pre-processing by Spectrum Quant software. The ester C=O stretching vibration at 1745 cm-1 is the most characteristic of the biodiesel present in the sample.

Figure 2. Spectral regions of interest for the low concentration calibration model (0 - 10 %v/v biodiesel). Image Credit: PerkinElmer
A total of 67 standards were utilized to create the three starter calibration models. All standards and validation samples were acquired from Spectrum Quality Standards, Houston, USA.
Figures 3 – 5 exhibit the linear PLS curves of each calibration model, with the coefficient of determination (R2) and the standard error of prediction (SEP) labeled on the respective curve.

Figure 3. Low concentration PLS calibration curve. Image Credit: PerkinElmer
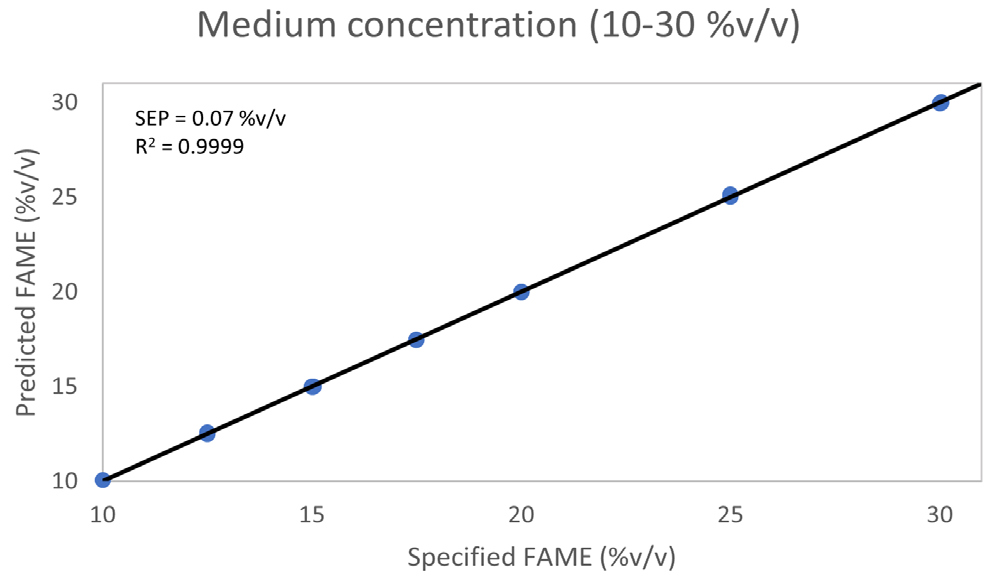
Figure 4. Medium concentration PLS calibration curve. Image Credit: PerkinElmer

Figure 5. High concentration PLS calibration curve. Image Credit: PerkinElmer
All models show excellent linearity with an R2 of 0.999 or more and a low SEP, indicating the suitability and accuracy of the Spectrum Two and MIRacle ATR for this application.
Instrument Validation
A set of validation standards is required to validate the three calibration models to establish whether the instrument qualifies for the analysis. A set of 25 validation standards was employed, spanning all three calibration models.
Like the standards utilized for calibration, these validation standards comprised a matrix of diesel fuel of differing cetane index corresponding to the ASTM method.
Table 2 presents the prediction results for two validation standards from each calibration model. The results suggest a high level of agreement between the reference and predicted figures for all three calibration models.
Table 3. Selected validation results from the three calibration models. Source: PerkinElmer
| Description |
Reference Biodiesel Conc. (%) |
Predicted Biodiesel Conc. (%) |
| Sample 1 (low calibration) |
1.30 |
1.27 |
| Sample 2 (low calibration) |
4.50 |
4.43 |
| Sample 1 (medium calibration) |
12.00 |
12.17 |
| Sample 2 (medium calibration) |
25.00 |
25.13 |
| Sample 1 (high calibration) |
40.00 |
40.22 |
| Sample 2 (high calibration) |
96.00 |
95.85 |
ASTM D7371 specifies that the standard error for the calibration range of 0 - 20 %v/v biodiesel must not exceed the pooled error (PSEQ) detailed in the ASTM method for an instrument to be qualified to conduct this analysis.2
The ASTM method specifies that the PSEQ should be 0.21 % v/v. The measured error of 0.18 determined from the results obtained using the Spectrum Two and MIRacle ATR signifies that the instrument is qualified to conduct this analysis.
Table 3 displays the calibration and validation results for the three calibration ranges in addition to the standard error determined for the range of 0 – 20 %v/v biodiesel.
Table 4. Validation results. Source: PerkinElmer
| Model |
R2 |
Latent Variables |
SEP (Cross Validation) |
SEP (External Validation) |
| Low (0 - 10 %v/v) |
0.9997 |
3 |
0.13 |
0.15 |
| Medium (10 - 30 %v/v) |
0.9999 |
4 |
0.10 |
0.19 |
| High (30 - 100 %v/v) |
0.9998 |
4 |
0.93 |
0.46 |
| ASTM qualification (0 - 20 %v/v) |
0.9994 |
3 |
0.20 |
0.18 |
Analysis Workflow Options
For collecting and processing data on the Spectrum Two and MIRacle ATR, three software options may be used to employ the calibration models and analyze samples.
These are the following:
- Utilizing the Predict function within Spectrum Quant
- Utilizing the calibration models generated in Spectrum Quant within Spectrum IR software
- Integrating the Spectrum Quant models in a Spectrum Touch macro
Editing the calibration models may be conducted with Spectrum Quant software. A user can produce a fresh calibration using the spectra of a new set of standards prepared in agreement with ASTM D7371. Existing calibrations may also be updated with a bias correction or improved by adding spectra of added standards.
Spectrum IR enables the collection of standard or sample spectra and the processing of these spectra with the Spectrum Quant models. Lastly, Spectrum Touch enables the collection of sample spectra and the prediction of biodiesel content from these spectra in the same software workflow.
Ease of Analysis Workflow with PerkinElmer’s Spectrum Touch Software
The calibration models may be integrated into a Spectrum Touch macro to offer step-by-step assistance for an analyst with the additional advantage of including an SOP for sample/standard preparation and analysis procedure. This provides a streamlined workflow for fast and straightforward analysis.
Figure 6 displays the detail of the results screen from Spectrum Touch, including the results table and spectrum of a sample. Results can subsequently be contained in a .pdf report file or exported in .csv format for additional data processing.

Figure 6. Results from the Spectrum Touch macro. Image Credit: PerkinElmer
Conclusion
PerkinElmer Spectrum Two with the PIKE MIRacle 9-bounce diamond/ZnSe ATR delivers an accurate, robust, and portable solution for the quantification of biodiesel according to ASTM D7371.
Analyzing diesel samples using the Spectrum Two and MIRacle ATR is accurate and straightforward, with all three PLS calibrations exhibiting superb linearity.
The external validation SEP reached in the 0 – 20 %v/v biodiesel concentration range was 0.18%, which is less than the limit indicated by the ASTM method and signifies that the instrument is qualified to conduct this analysis.
Spectrum IR, Spectrum Touch, and Spectrum Quant software deliver a robust suite of tools for obtaining and processing data as the user requires. The calibration models may be utilized to correct bias or as a template for updating with spectra collected from the users’ standards.
The standards utilized for the production of the calibration models for this application all utilized biodiesel from the same source. Biodiesel obtained from a different source may result in spectra with differences that could demand additional calibration model modification or recalibration with the relevant standards.
Acknowledgments
Produced from materials originally authored by Nicholas Lancaster at PerkinElmer, Johannesburg.
References and Further Reading
- Alleman, Teresa L., McCormick, Robert L., Christensen, Earl D., Fioroni, Gina, Moriarty, Kristi, and Yanowitz, Janet. “Biodiesel Handling and Use Guide (Fifth Edition). United States: N. p., 2016 Web.
- ASTM D7371, 2014, “Standard Test Method for Determination of Biodiesel (Fatty Acid Methyl Esters) Content in Diesel Fuel Oil Using Mid Infrared Spectroscopy (FTIR-ATR-PLS Method),” ASTM International, West Conshohocken, PA, 2014, DOI: 10.1520/D7371-14, www.astm.org.
- “Absolute Virtual Instrument (AVI) PerkinElmer, 2005.
- “Diamond ATR and Calibration Transfer for Biodiesel Blend Analysis by ASTM D7371” Ben Perston and Nick Harris, PerkinElmer, 2009.

This information has been sourced, reviewed and adapted from materials provided by PerkinElmer.
For more information on this source, please visit PerkinElmer.