Microlenses have many applications, such as coupling light into fiber optics, enhancing light source uniformity in microdisplays, and focusing light onto imaging sensors in mobile phone cameras.
Current microlens research investigates variations on the simple spherical microlens design to minimize effects such as astigmatism, distortion, and diffraction and to optimize microlens shape for specific imaging applications, including automobiles, mobile phones, and virtual reality goggles.
This article discusses the use of Bruker white light interferometry (WLI) platforms for efficient and accurate microlens characterization, particularly for lenses that are not perfectly spherical.
A spherical lens with a fixed radius of curvature is the simplest microlens. Spherical lenses are often replaced by more complex aspheric shapes to reduce distortion, allow for sharper focusing, and correct for astigmatism. However, characterization of aspheric lenses is challenging since they do not have a constant spherical shape.
Fresnel microlenses introduce new diffraction effects, but can be utilized to reduce chromatic aberration. Free-form optics have an even more complex design, but they provide enhanced performance and new functionality while potentially reducing weight, size, and cost.
All the above lens types are usually fabricated via etching or molding glass, infrared crystals, silicon, or plastic substrates to produce an array of microlenses, as shown in Figure 1.
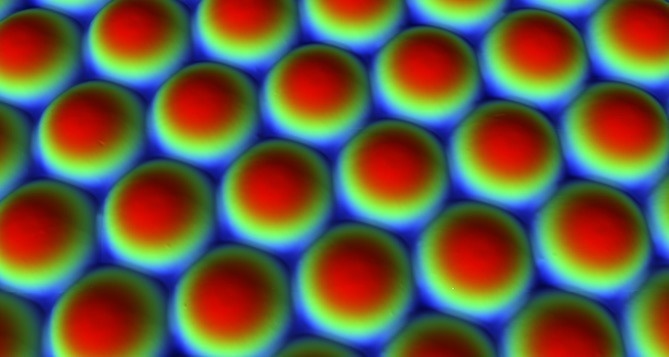
Figure 1. Microlens array used for focusing light onto the sensor. Image Credit: Bruker Nano Surfaces and Metrology
High surface quality and optimal microlens shape are essential for correctly and efficiently focusing light onto an intended surface, such as a camera array.
The radius of curvature (ROC) is the most crucial shape parameter, as it defines whether the lens is concave, plano, or convex, and determines the optical path length of the rays.
A high lens surface quality mitigates light diffraction while maintaining the highest modulation transfer function (MTF). The MTF quantifies the contrast and resolution performance of an imaging system.
Some examples of common defects that reduce surface quality include pits, scratches, bubbles, digs, and inclusions.
To understand or predict a microlens’ performance, the defect architecture and the radius of curvature must be fully characterized.
White Light Interferometry
White light interferometry (WLI) is also known as coherence scanning interferometry. The technique utilizes an optical microscope with special interferometric objectives that produce moiré fringes based on a split light beam's constructive and destructive interference.
The pattern generated by these moiré fringes is used to determine the sample height at each point. Figure 2 presents a schematic of a typical white light interferometer.
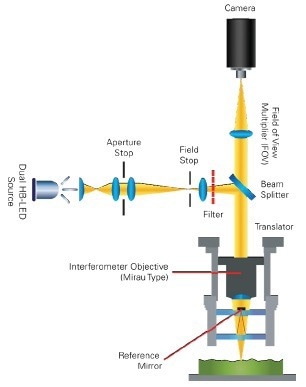
Figure 2. Schematic of a typical white light interferometer. Image Credit: Bruker Nano Surfaces and Metrology
To acquire complete topographical information, the image stacks are collected using either (a) scanning optics through focus to generate a fringe envelope (VSI/USI measurement modes) or (b) phase-shifting fringes by 90° (PSI measurement mode).
WLI enables a large field of view, micron-level lateral resolution, and sub-nanometer height resolution at any magnification. This makes WLI an ideal method for 3D non-contact measurements of surface shape and roughness of microlenses and other optical components.
Bruker’s WLI Data Collection
As displayed in Figure 3, three different WLI measurement modes exist which may be used for microlenses:
- Vertical scanning interferometry (VSI) is the most versatile mode, measuring 100 nm to 10 mm features.
- Universal scanning interferometry (USI) is highly repeatable and provides measurements for feature heights down to the angstrom level. Both USI and VSI utilize the moiré fringe coherence envelope generated by the interferometric objective, but USI also utilizes other known fundamentals, including intensity and modulation, to deliver higher resolution on microlenses.
- Phase-shifting interferometry (PSI) is the fastest and most repeatable measurement mode. PSI phase-shifts the coherent light by 90° to acquire sub-angstrom gauging.
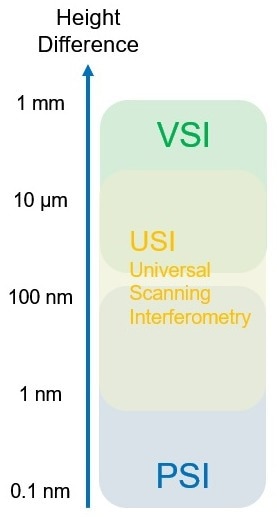
Figure 3. Measurement mode bridging below 1 mm. Image Credit: Bruker Nano Surfaces and Metrology
Stitching multiple images together can resolve the issue of a microlens being unable to fit into a single field of view. Rather than using a standard rectangular grid, obtaining a stitched image for a microlens begins at the apex of the lens and then steps down, spiraling down around the lens.
In addition to this spiral stitching, Bruker presents further speed improvements for data acquisition, such as:
- Autoscan — automatically stops the scan once all data is acquired
- Autofocus — automatically finds the surface
- Home Scanner — starts the following scan where data was obtained on the most recent measurement
- Auto Tip Tilt — automatically sets the fringe orientation
- Pattern Matching — automatically centers or aligns the lens
Bruker’s Microlens Analysis Tools
Radius of curvature analysis
Radius of curvature (ROC) can vary across a microlens array due to factors such as uneven photoresist thickness or changes in the reactive ion beam etching process. Even minor process variability can result in substrate failure when ROC tolerances are tight.
A quick and straightforward analysis of ROC on a microlens array is provided with WLI since it is an areal technique with a large field of view. The simplest analysis for conducting ROC is removing the spherical shape and reporting the removed ROC.
Bruker’s SureVision analysis package enables a more advanced technique for this, which allows the automatic detection, alignment, and analysis of the microlens, and provides output for the ROC, height, and diameter of the microlens.
The SureVision analysis result outputs of ROC, conic parameters, and surface finish are presented in Figure 4.
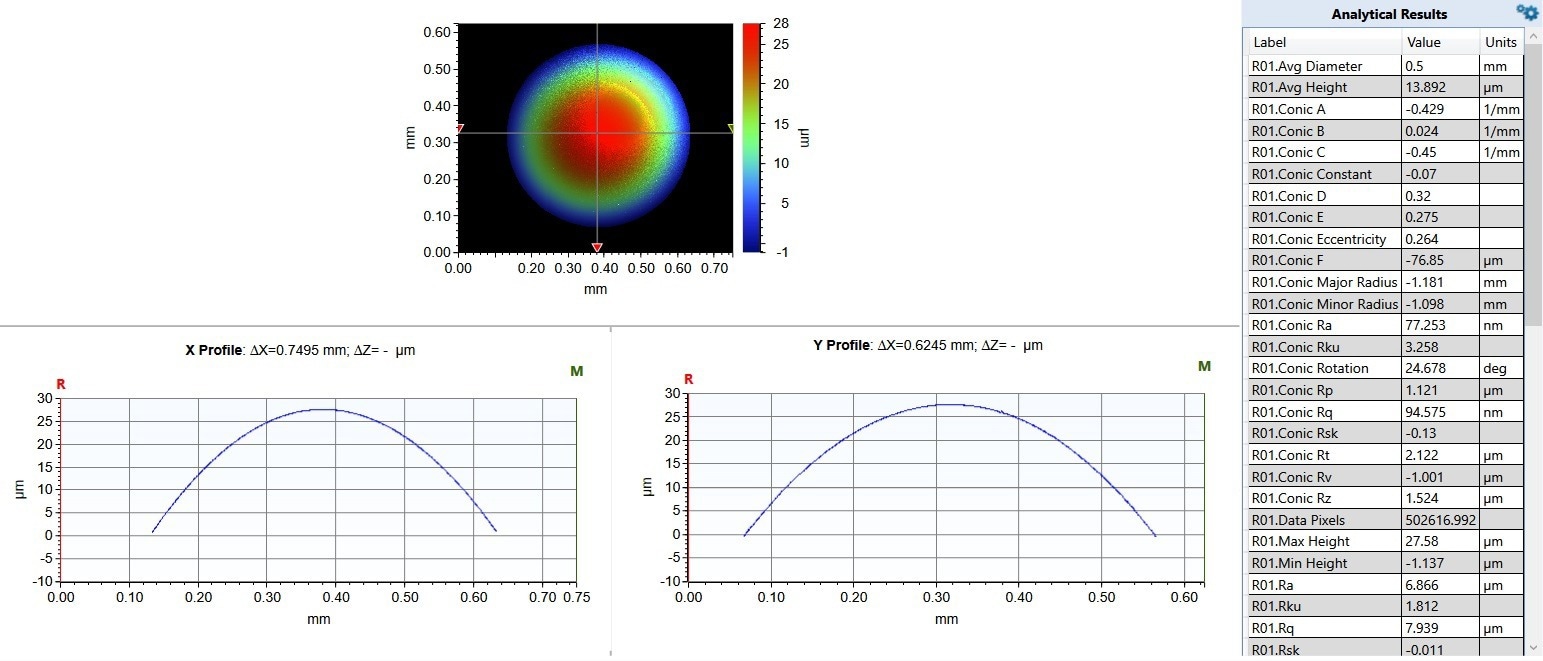
Figure 4. Automatic extraction of lens parameters. Image Credit: Bruker Nano Surfaces and Metrology
Multiple region analysis for arrays and defect detection
Microlens arrays consist of multiple lenses formed in a one-dimensional or two-dimensional array on a supporting substrate. Diameter, pitch, and height are crucial measurements for a microlens array.
Multiple Region (MR) analysis enables the automatic detection and analysis of up to 42 distinct relevant array parameters (including diameter, pitch, and height) on the detected microlenses.
Figure 5 displays an example microlens array measurement, including individual analysis for each lens and overall values for the measured lens array.
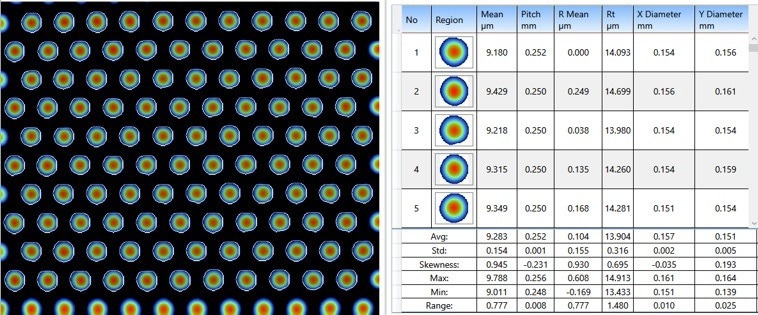
Figure 5. Microlens array analysis using Multiple Region, including some selected output parameters (Raw image and MR analysis). Image Credit: Bruker Nano Surfaces and Metrology
Once the form of the microlens is correctly removed via one of the numerous algorithms included in Bruker’s Vision64® software, MR analysis can be performed to identify defects.
MR can be used for the automatic detection of abnormalities on the surface. It is possible to set a height and depth threshold that will trigger the detection of those features greater than the threshold, with results for each detected defect provided with various relevant parameters, such as those presented in Figure 6.
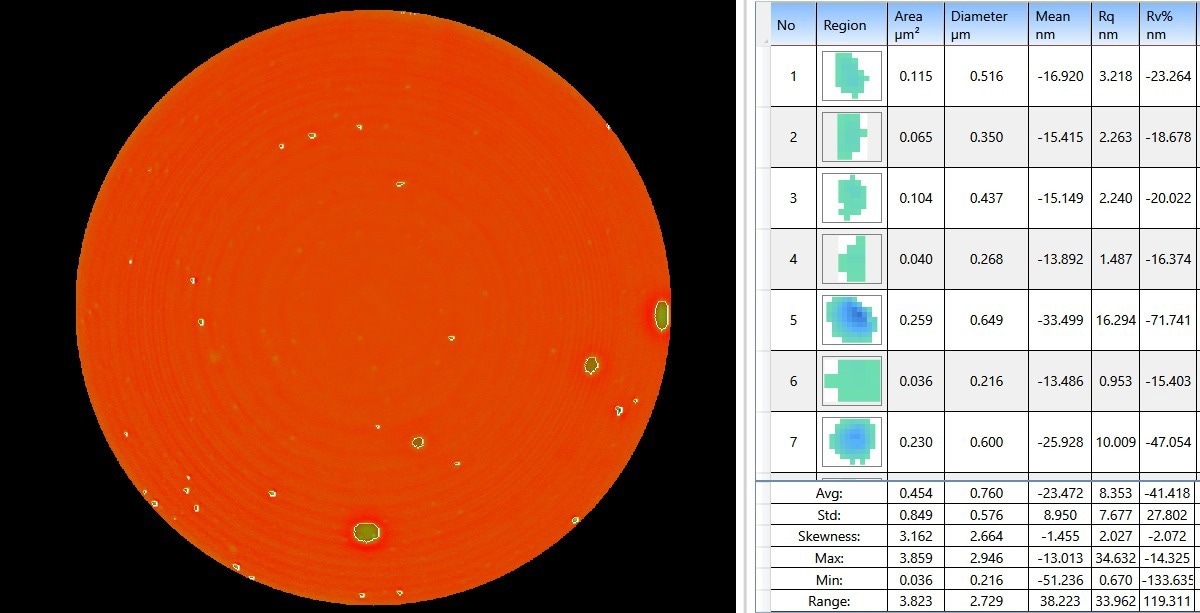
Figure 6. Defect detection, circled in white, using Multiple Region analysis to characterize those defects. Image Credit: Bruker Nano Surfaces and Metrology
Specialized lens analyses
- Zernike Analysis —Zernike analysis can be fully automated to locate a lens, align to center the lens, crop off the substrate, and conduct data analysis. Zernike analysis utilizes an orthogonal circular-function fitting to remove the form, reporting up to 36 Zernike parameters, as shown in Figure 7. The surface texture parameters and standard radius of curvature are also reported.
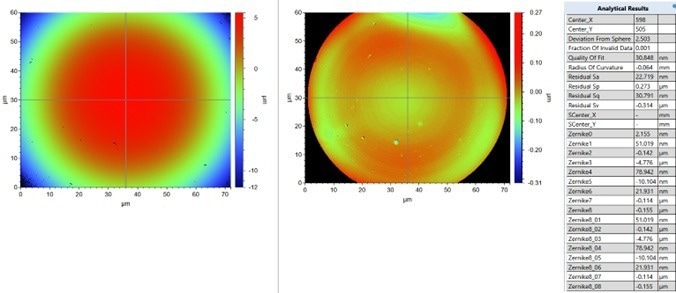
Figure 7. Zernike analysis showing before and after form removal while reporting some of the output parameters. Image Credit: Bruker Nano Surfaces and Metrology
- Asphere and Zernike Generation and Subtraction — Asphere and Zernike wavefronts may be produced from the optic design print and subtracted from the measured microlens. An automated Subtract Asphere algorithm reports the ROC removed and surface texture parameters. The general subtraction function can use the measurements to automatically align the generated wavefront for further analysis. As shown in Figure 8, the residual image can subsequently be run through the numerous built-in automatic analyses from form to surface analysis.
Figure 8. Generated asphere wavefront subtracted from measurement showing the residual of the subtraction. Image Credit: Bruker Nano Surfaces and Metrology
- Fresnel Analysis — Fresnel analysis can automatically detect and report the step depths of up to 14 steps on diffractive-type microlenses, with an example presented in Figure 9. If analysis is needed on more steps, the Multiple Region analysis can be employed to detect and report these heights.
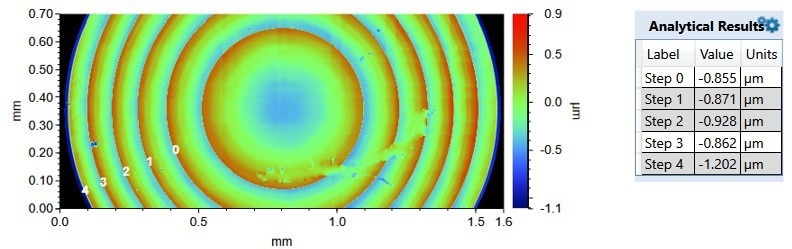
Figure 9. Fresnel analysis of a diffractive optic showing the analysis and step heights. Image Credit: Bruker Nano Surfaces and Metrology
Conclusion
The full characterization of microlenses can facilitate functionality predictions, resulting in better designs and improved reliability. The efficient and accurate technique of white-light interferometry allows 3D non-contact optical profiling that can be utilized for quantifying and visualizing microlens shape and surface texture.
With the improvements to the measurement and analysis workflows enabled by Bruker, evaluating microlenses is simple and user-independent. These improvements include spiral stitching, multiple measurement modes, SureVision, specialized lens analyses, and Multiple Region analysis.
Bruker WLI-based profiler configurations provide a solution for any microlens characterization need, with a wide variety of tool types on offer, including benchtop and self-calibrating, fully automated systems.
Acknowledgments
Produced from materials originally authored by Roger Posusta and Samuel Lesko at Bruker Nano Surfaces and Metrology.

This information has been sourced, reviewed and adapted from materials provided by Bruker Nano Surfaces and Metrology.
For more information on this source, please visit Bruker Nano Surfaces and Metrology.