Modern lithium-ion batteries exhibit high efficiency and capacity, boasting extended cycle lives.

Image Credit: TOFWERK
These attributes, alongside their low self-discharge rate and minimal memory impact, render lithium-ion batteries a cost-effective solution for various applications, from electronic gadgets to electric vehicles (EVs) and even substantial stationary energy storage systems.1
The pace of innovation in this domain remains rapid, with the ongoing growth of the electric vehicle market serving as a significant catalyst for further advancements, including the exploration of novel cathode materials.2
The notable enhancements in performance over the past three decades since the commercial introduction of lithium-ion batteries have primarily hinged on advances in materials technology, which, in turn, heavily relied on the ability to chemically analyze and visualize materials and devices.
The TOFWERK fibTOF detector for secondary ion mass spectrometry is an ideal tool for mapping the distribution of lithium within intricate materials across a broad spectrum of concentrations.
Challenges in Lithium-Ion Battery Characterization
In rechargeable lithium-ion batteries, lithium assumes a pivotal role as the charge-carrying ion (Li+), which intercalates into the host material of the electrode and electrolyte, migrating from the cathode to the anode during charging and, conversely, during discharge.3
Processes taking place during cell operation, leading to chemical or structural degradation of electrode interfaces (aging effects), are garnering increasing attention as the linchpin for enhancing cycle life.4
Identifying changes in chemical composition over time and the ability to profile these processes and their impacts on device functionality necessitate the ability to visualize lithium's spatial distribution and other pertinent components with high spatial precision.
Instrumentation that empowers such chemical imaging can significantly bolster the ongoing development of this technology.5,6
FIB-SIMS Solutions
Integrating a mass analyzer into a FIB-SEM microscope enables the analysis of light elements in battery research by facilitating secondary ion mass spectrometry (SIMS) imaging. The FIB's energetic ion gun serves as the primary ion source, producing secondary ions (both positive and negative) through the solid material's sputtering process.
This measurement setup is referred to as FIB-SIMS, enabling complementary assessments, such as studying lightweight elements.
The fibTOF device, developed by TOFWERK, offers swift visualization of the spatial distribution of all elements with high resolution (horizontal <50 nm and vertical <10 nm). It boasts a mass resolving power exceeding 700 and the capacity for sensitive detection of low-mass elements such as hydrogen, boron, lithium, and fluorine down to ppm levels.
It is excellently suited for lithium-ion battery research because it exhibits high sensitivity to lithium (which yields one of the highest secondary ions among all elements).
The spatial resolution of the FIB-SIMS technique is challenging to match without resorting to laborious transmission electron microscopy techniques, demanding the creation of thin lamellas through FIB.
The fibTOF is an orthogonal time-of-flight (TOF) mass analyzer specifically designed as an add-on instrument for FIB-SEM microscopes, and it is compatible with leading FIB-SEM manufacturers, including Thermo Fischer Scientific, Tescan, and Zeiss.
Lithium-Ion Battery Characterization Examples
The following figures display data for various rechargeable lithium-ion pouch cell elements. A segment of the electrode stack was excised and positioned on the SEM stub for analysis.
These figures underscore the fibTOF's capability to portray the spatial distribution of lightweight elements with exceptional spatial precision.
This research employed a Ga FIB with the beam precisely aligned perpendicular to the sample surface. The FIB beam operated at an energy level of 30 kV, and the pixel dwell time was set at 10 µs, covering a mass range from 1 to approximately 180 amu.
2D Imaging of Elements
Figure 1 provides chemical maps for hydrogen, lithium, sodium, and aluminum. These maps were generated by systematically scanning the FIB beam across an area measuring 100 µm x 100 µm, repeating the process 512 times while maintaining an ion current of 130 pA.
Each scanned frame consisted of 512 x 512 pixels, with data averaging (binning) conducted over 4 by 4 pixel blocks, resulting in 128 effective pixels. Under these parameters, high-quality maps of the elements were obtained.
The fibTOF can detect hydrogen, although the hydrogen observed in this instance primarily results from water molecules in the microscope chamber's residual gas.
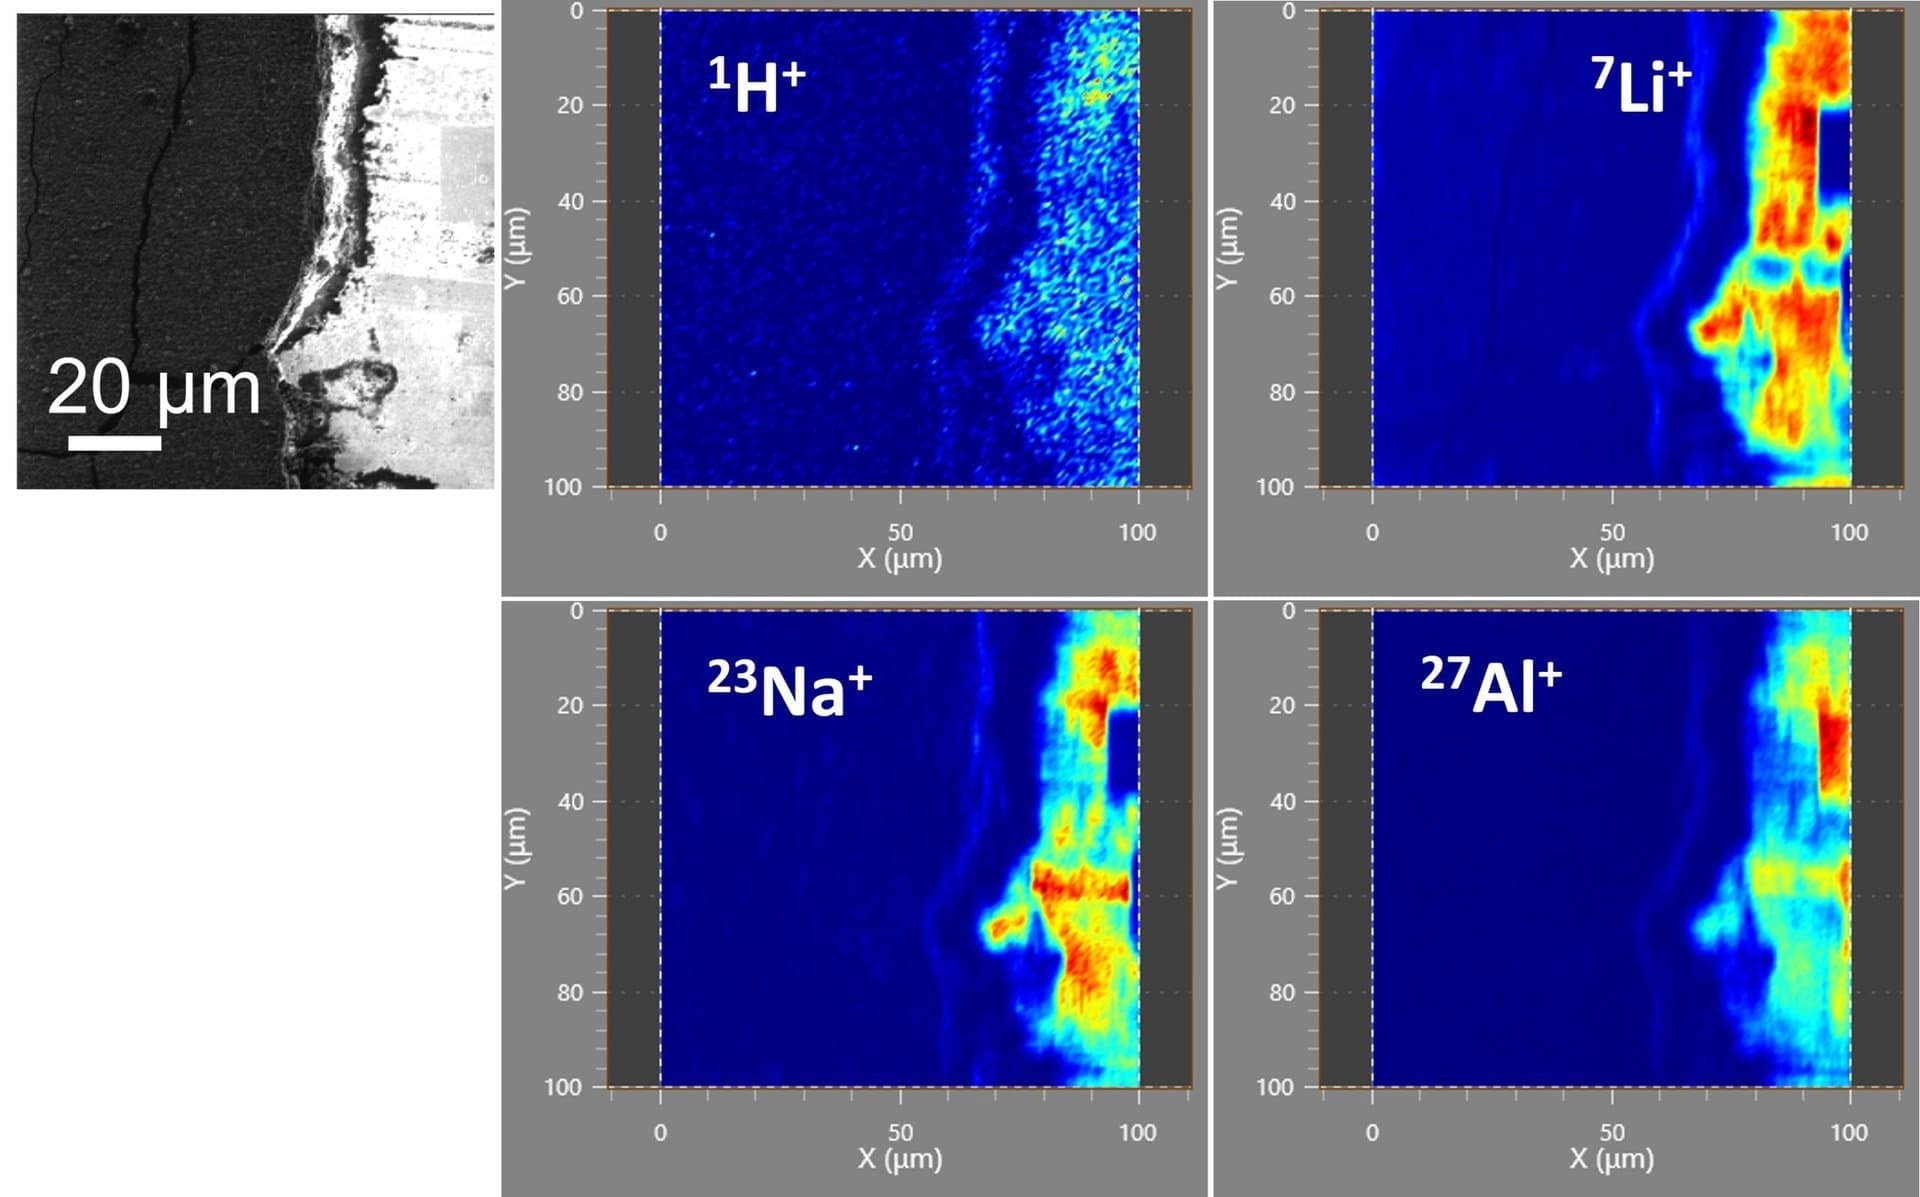
Figure 1. FIB-induced secondary electron image on the left and secondary ion elemental maps of H, Li Na, and Al on the right. Image Credit: TOFWERK
To enhance spatial resolution, the acquisition conditions were adjusted compared to Figure 1: the field of view reduced to 5 µm, pixel dimensions set at 1024 x 884, ion current fixed at 1.5 pA, and binning adapted to 2 x 2.
This smaller field of view and less aggressive binning have decreased effective pixel size compared to Figure 1, now at 11 nm. The lower ion current yields a smaller FIB spot size.
Figure 2 displays an image of the total lithium signal (6Li and 7Li), using a custom peak table entry in the user interface software, accumulated over 30 frames. Features much smaller than 100 nm are observable with the modified acquisition conditions.
It is important to note that topographical effects likely influence the intensity distribution due to the sample's rough surface.
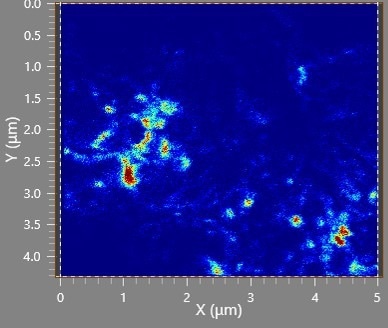
Figure 2. High-resolution image of Li (7Li+6Li). Image Credit: TOFWERK
Imaging of Sublayers
FIB-SIMS inherently acquires a 3D dataset, allowing the fibTOF to visualize elemental distributions along the FIB beam's erosion direction (Z). This extends beyond a simple 1D depth profile. From the 3D dataset, various slices and regions of interest can be selected.
The images presented in Figure 3a are front projections of the imaged cube, mapping different chemical layers along the sample depth. For example, in this case, there is a thin layer of adsorbed hydrogen at the surface, a surface layer consisting of lithium, and an aluminum sublayer.
While the fibTOF cannot directly determine depths, a local depth can be calculated from the known fluence and the estimated sputter yield. Figure 3b presents the same dataset as depth profiles. Here, the counts per extraction of each pixel within a frame are summed to a value.
This representation may be more convenient for tracking trends along the depth, especially when investigating film interfaces. Given that lithium-ion batteries often comprise layered films, FIB-SIMS facilitates the study of mass diffusion processes and the resolution of issues.
The measurement in Figure 3 was recorded with an ion probe current of 50 pA, a field of view of 10 µm, and a resolution of 512 x 442 pixels with 2 x 2 binning.
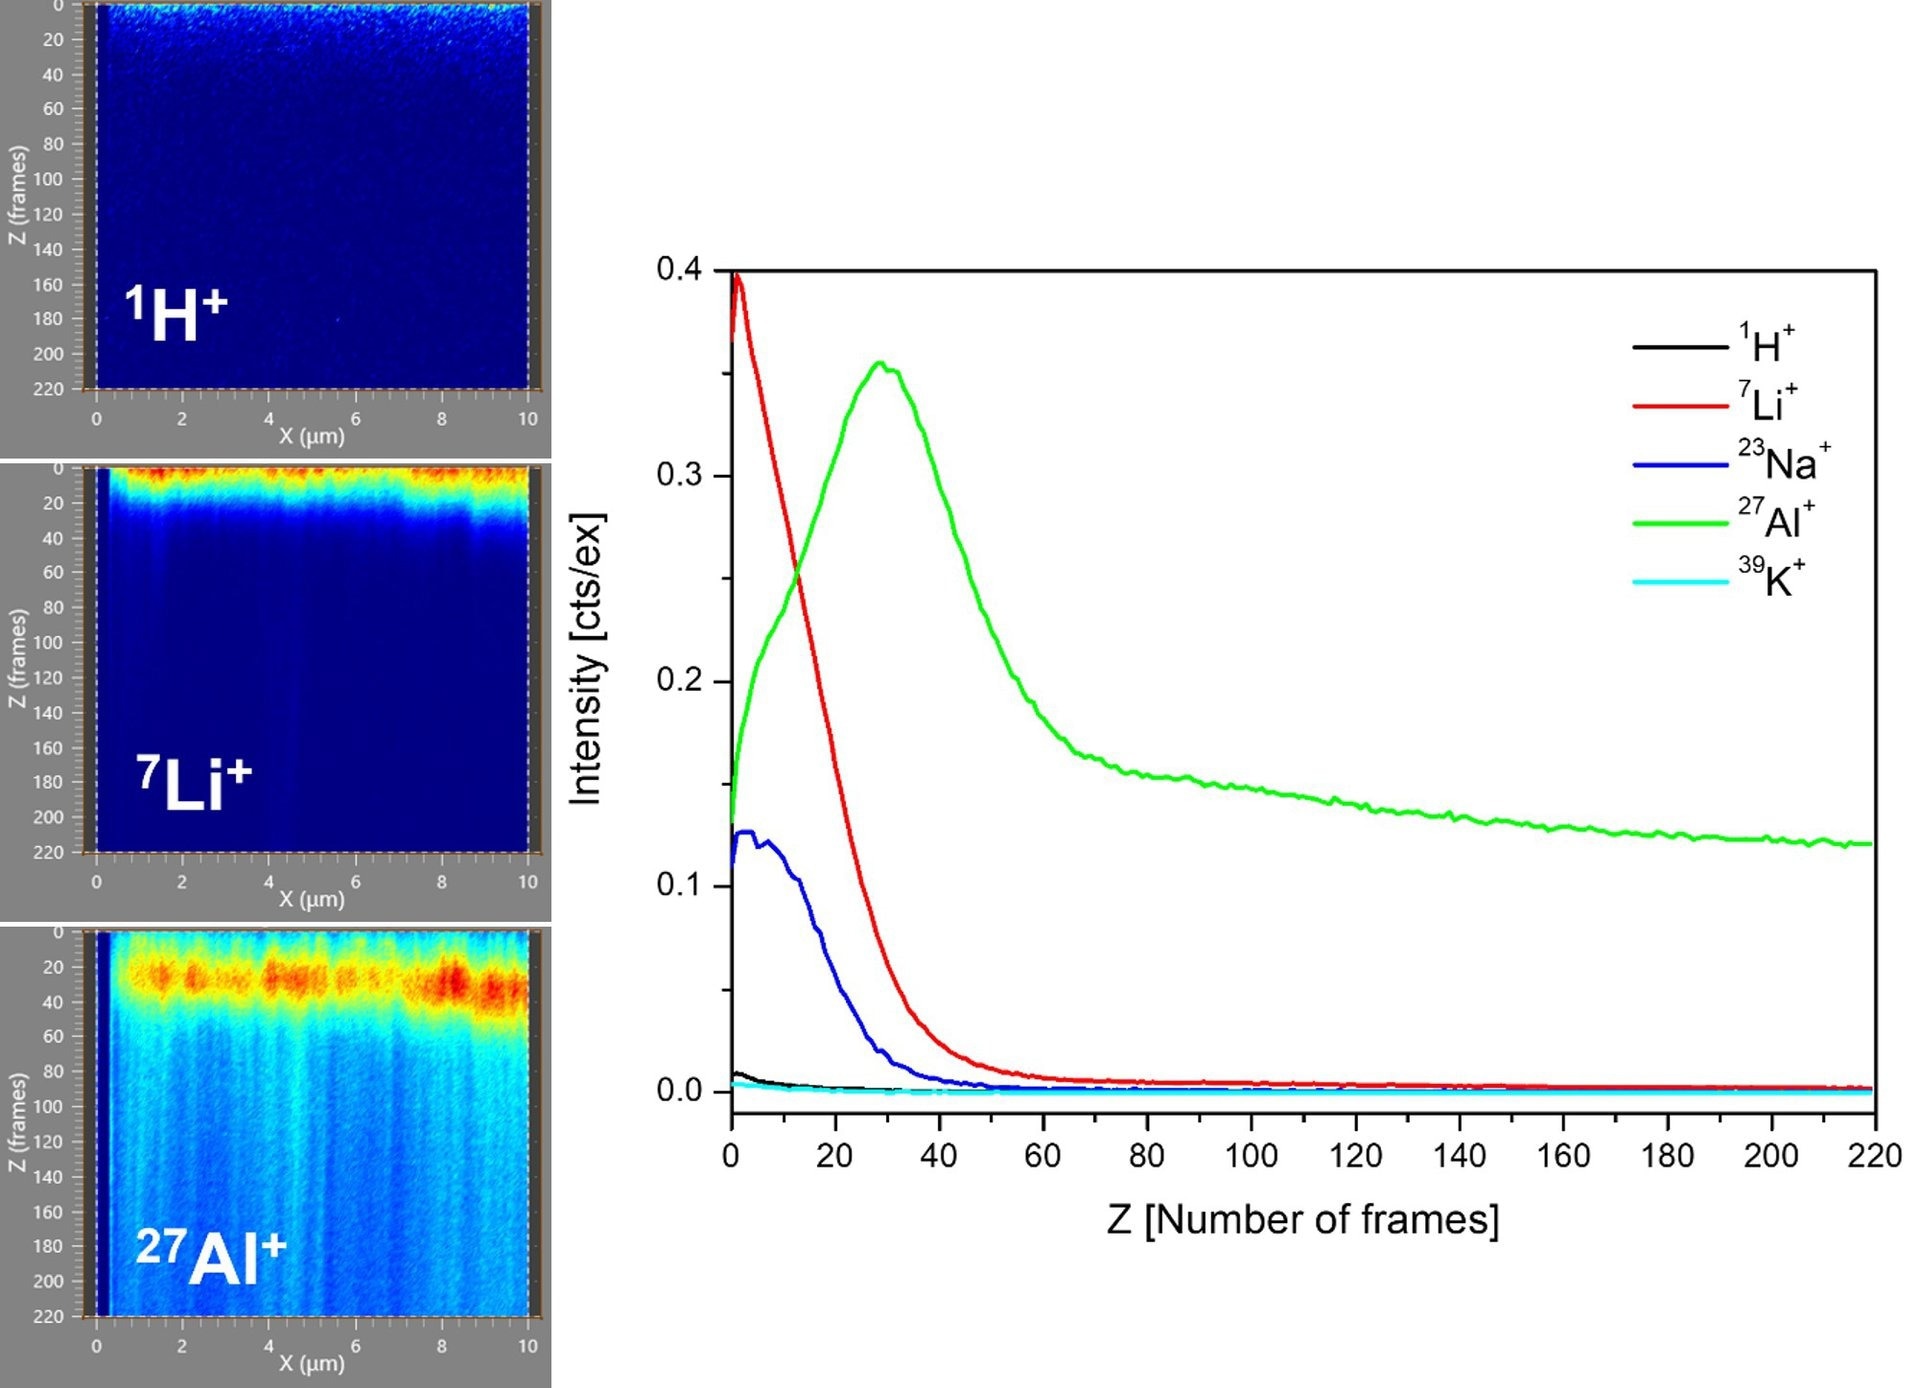
Figure 3. Left: 2D maps along the depth for 1H, 7Li, and 27Al; Right: depth profiles with additional 23Na and 39K isotopes. Image Credit: TOFWERK
Measurement of Fluorine
By changing the polarity of the applied voltages at the ion optics of the fibTOF, it becomes feasible to measure negatively charged secondary ions.
The following example in Figure 4 illustrates top and side maps of a fluoride measurement taken on a 10 x 10 µm area with 512 x 512 pixels and no binning applied, using a 133 pA FIB current. The capability to image fluoride may become pertinent for future fluoride ion batteries.7
These batteries, first reported in 2011, have the potential to evolve into cost-effective, lightweight rechargeable energy sources with the theoretical possibility of higher energy storage densities than lithium-ion batteries. A key area of research involves identifying and testing fluoride ion conducting materials.
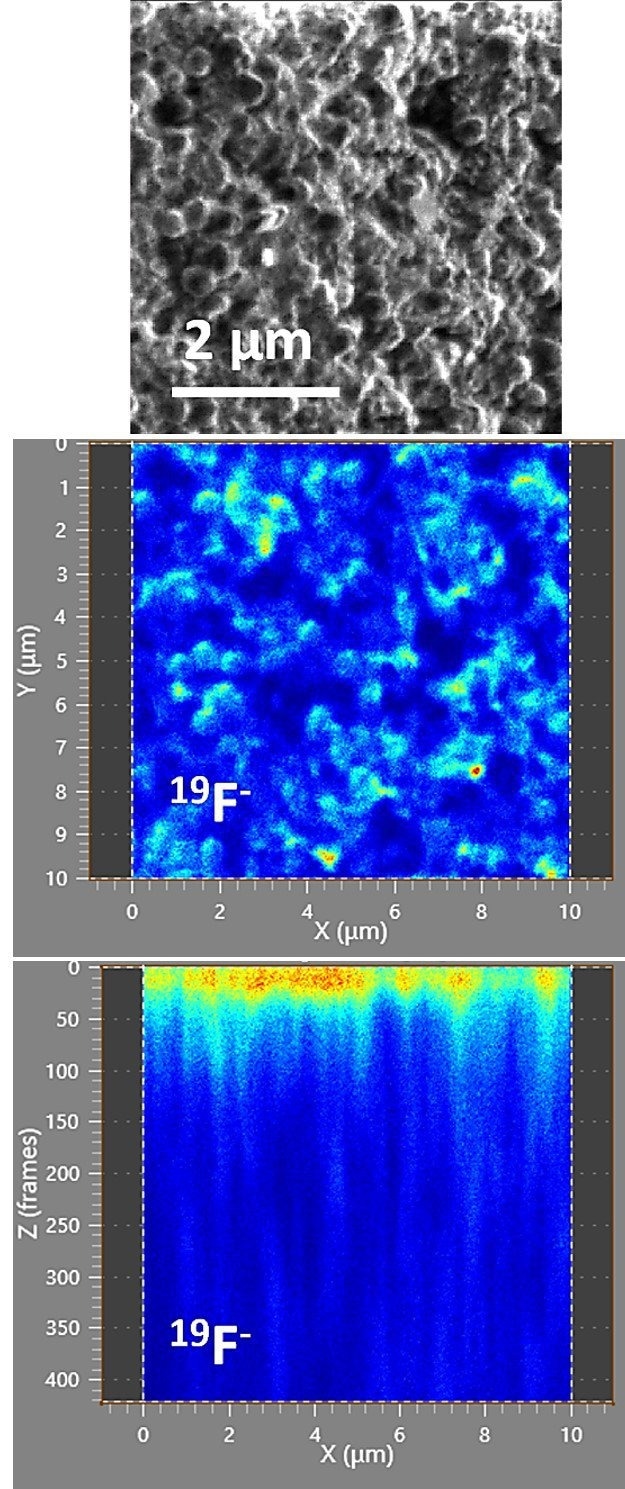
Figure 4. Top panel shows the secondary electron FIB image of the imaged area before erosion, and the middle and bottom panels show an intensity map of the fluorine isotope from the top and along the depth. Image Credit: TOFWERK
Alternative Approaches
Energy dispersive X-Ray spectroscopy (EDS) combined with dual-beam focused ion beam/secondary electron microscopy (FIB-SEM) stands as a standard technique for element imaging.
This method encounters challenges when detecting light elements due to the low energy and high absorption probability of emitted X-Rays, rendering it inadequate for extensive analysis of elements like Li ions.
The graph in Figure 5 illustrates a resolution-sensitivity landscape showcasing various analytical techniques' measurement capabilities. Improvements in the brightness of FIB sources enable higher spatial resolutions, surpassing historical associations with dynamic SIMS.
FIB-SIMS falls somewhere between STEM/EDS and dynamic SIMS, achieving detection limits as low as ppm and spatial resolutions below 50 nm.
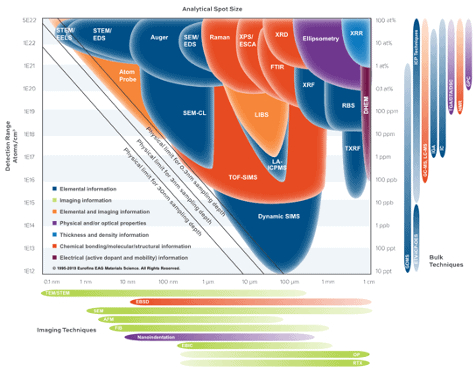
Figure 5. Comparison of lateral resolution-sensitivity of different analytical techniques. Copyright © EAG, www.eag.com. Image Credit: TOFWERK
Conclusion
This article highlights the utilization of fibTOF for imaging light elements relevant to lithium-ion batteries. These light elements pose challenges for imaging with comparable spatial resolution using other techniques.
The study demonstrates that lithium can be readily detected at spatial resolutions below 100 nm, with the potential for further enhancement. To gain a comprehensive understanding of the research and development of rechargeable Li-ion batteries, it is recommended to use fibTOF as a complementary technique alongside EDS.
References
- Improving Performance and Safety of Lithium-Ion Batteries: Characterizing Materials and Interfaces, L Romano. https://www.eag.com/resources/whitepapers/ or Lithium-ion batteries: outlook on present, future, and hybridized technologies DOI Journal of Materials Chemistry A https://doi.org/10.1039/C8TA10513H
- Future material demand for automotive lithium-based batteries. Chengjian Xu, Qiang Dai, Linda Gaines, Mingming Hu, Arnold Tukker and Bernhard Steubing. Communications Materials 99(2020) https://doi.org/10.1038/s43246-020-00095-x
- Lithium solid-state batteries: State-of-the-art and challenges for materials, interfaces and processing, Nicola Boaretto, Iñigo Garbayo, Sona Valiyaveettil-SobhanRaj, Amaia Quintela, Chunmei Li, Montse Casas-Cabanas, Frederic Aguesse, Journal of Power Sources, 502, (2021) 229919. ISSN 0378-7753, https://doi.org/10.1016/j.jpowsour.2021.229919
- Challenges for Rechargeable Li Batteries, (2010) John B. Goodenough and Youngsik Kim
- In situ visualization of Li concentration in all-solid-state lithium ion batteries using time-of-flight secondary ion mass spectrometry, Hideki Masuda, Nobuyuki Ishida, Yoichiro Ogata, Daigo Ito, Daisuke Fujita.Journal of Power Sources (2018), 400, 527-532.
- Blocking Lithium Dendrite Growth in Solid-State Batteries with an Ultrathin Amorphous Li-La-Zr-O Solid Electrolyte, Jordi Sastre, Moritz H. Futscher,Lea Pompizi, Abdessalem Aribia, Agnieszka Priebe, Jan Overbeck, Michael Stiefel, Ayodhya N. Tiwari and Yaroslav E.Romanyuk
- Advanced Fluoride-Based Materials for Energy Conversion, Ed. T Nakajima and H Groult, (2015) Elsevier 978-0-12-800679-5, https://doi.org/10.1016/C2013-0-18650-3

This information has been sourced, reviewed and adapted from materials provided by TOFWERK.
For more information on this source, please visit TOFWERK.