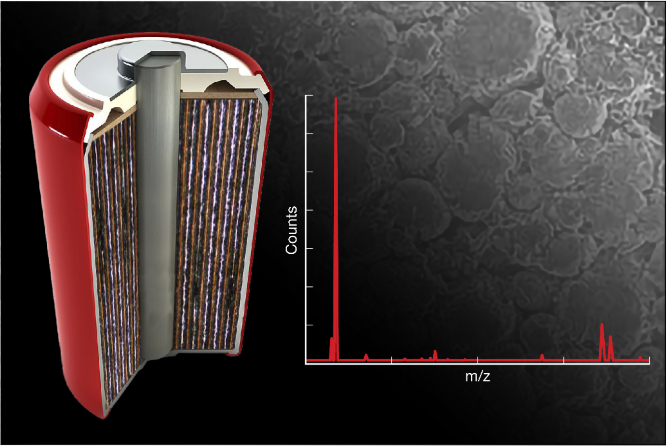
As manufacturers and regulators pivot towards vehicle electrification,1 lithium-ion batteries (LIBs) remain the most widely adopted, safe, and relatively affordable energy storage technology.2

Image Credit: Thermo Fisher Scientific – Software
The rapid increase in demand for electric vehicles has expanded the scope of battery research and quality assurance.3,4 As batteries are highly structured and multiscale devices, inspecting components at several length scales can assure a certain level of performance and reliability.5
Like other chemical batteries, LIBs rely on nanoscale interactions between a positively charged cathode and a negatively charged electrode. If the distribution of chemicals and supporting materials is interrupted or degraded, the battery will lose capacity or could experience thermal runaway.6
Verifying the nanoscale distribution of materials is best achieved with electron microscopy, such as a scanning electron microscope (SEM). Given that the structures are heterogeneous, many 2D cross-sections or a 3D view from serial sections provide more trustworthy microstructure information.7,8
Challenges in Lithium Detection with SEM and Advances in 3D Elemental Mapping
Currently, images from scanning electron microscopy (SEM) can be paired with rasterized chemical maps obtained through energy-dispersive X-ray spectroscopy (EDS). This technology relies on characteristic X-ray peaks emitted from the imaging process, yet the method struggles to measure lithium due to the low energy of characteristic X-rays emitted.9
Other spectroscopy techniques extend the detection range to include lithium and other light elements, but they are typically for bulk sample analysis or 2D maps only.
Thermo Fisher Scientific recently partnered with TOFWERK to provide an add-on for SEMs that allows elemental mapping of lithium at the nanoscale in 3D in materials such as LIB cathodes.10,11
Utilizing ToF-SIMS and FIB-SEM for 3D Nanoscale Mapping of Lithium
Time-of-flight secondary ion mass spectrometry (ToF-SIMS) employs a trusted spectroscopic technique.12 This method collects and separates isotopes according to their mass-to-charge ratio (m/z), and samples can be collected from a variety of methods, such as by sputtering material from the SEM imaging process.
The sputtered ions are produced as a by-product of the milling process in focused ion beam SEM (FIB-SEM).13 Here, an ion beam (e.g., gallium) is drawn across the surface of a sample to incrementally cut and expose successive layers for serial 3D imaging.
Compared to standalone ToF-SIMS, milling the surface increases the spectral depth profile and allows for precise ion milling with a smaller ion beam spot size. By milling the sample and performing 2D imaging layer after layer, the 3D distribution of light isotopes such as lithium is revealed at the nanoscale in a way that is not possible with EDS.14
To illustrate this, scientists at Thermo Fisher Scientific produced a 3D map of 7Li+ within NMC811 (lithium nickel manganese cobalt oxide) cathode particles using ToF-SIMS and FIB cross-sectioning.11
To prevent chemical interactions between Ga+ ions and the sample, an Xe+ ion beam plasma FIB was employed.
Sequential milling of the sample surface with the plasma FIB allowed for spatial imaging of ion-induced secondary electrons and secondary ions. In other words, this process generates a topological map from the electrons and a chemical map from the ions, as detected by the ToF-SIMS instrument.
Automated 3D Imaging and Lithium Mapping in NMC811 Using ToF-SIMS and FIB-SEM
The high ionization yield of 7Li+ allowed quick data acquisition in the FIB-SEM compared to EDS acquisition.9 Thermo Scientific™ Auto Slice and View™ Software automated the ion milling, rocking polish, imaging, and communication with the ToF-SIMS, enabling correlated imaging of a consistently smooth surface.
Automated data acquisition took place over 23 hours. Ion-induced secondary electron images and rasterized ToF-SIMS maps were then aligned and jointly viewed in Thermo Scientific™ Avizo™ Software.15
The ToF-SIMS maps represent a depth profile deeper than the FIB-milled cut. This is useful when it comes to characterizing uneven surfaces like cathode batteries.
These spectral depth maps are directly read by Avizo Software and reconstructed into a 3D volume. Using the secondary electrons created by the Xe+ plasma FIB, the two images are easily correlated for downstream analysis.
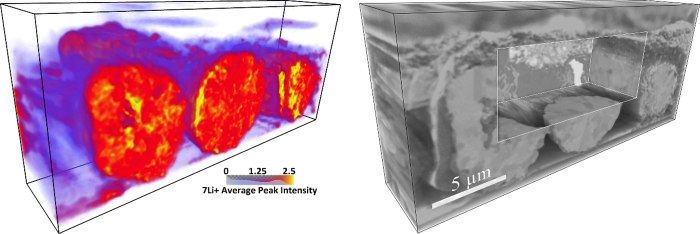
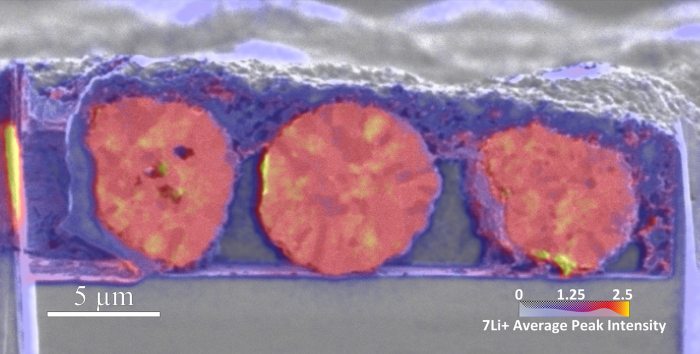
This 3D data revealed visible defects and internal cracks within the NMC811 secondary particles (Figure 1). Viewed with 2D cross-sections or with 3D rendering, ToF-SIMS imaging revealed a heterogeneous and unequal distribution of 7Li+ within the NMC811 secondary particles (Figure 2).

Figure 1. 3D rendering of lithium-containing cathode particles. Image Credit: Thermo Fisher Scientific – Software
On the left-hand side of the image above is a 3D chemical mapping of 7Li+ in NMC811 cathode particles using ToF-SIMS. On the right is a 3D secondary electron image of the same region produced from the Xe+ plasma FIB source.
A virtual cutout at the center of the volume enhances visibility through the sample's depth, revealing cracks and internal defects within the secondary particles.

Figure 2. Mixed overlay of 7Li+ and SEM image of cathode particle. Image Credit: Thermo Fisher Scientific – Software
The image above is a chemical mapping of 7Li+ in NMC811 cathode particles using ToF-SIMS. The spectral mapping is overlayed on the corresponding cross-section as viewed from the ion-induced secondary electron image produced from the Xe+ Plasma FIB milling process. The 7Li+ maps well to the secondary particles and confirms their internal distribution of lithium.
Advancing Nanoscale Lithium Detection in LIBs with Integrated FIB-SEM and ToF-SIMS for Improved Battery Performance
Ultimately, the combination of FIB-SEM and ToF-SIMS successfully illustrates how light particles, such as lithium ions, can be seen at the nanoscale resolution at which LIB chemistry occurs.
Uniquely, by pairing FIB-SEM with ToF-SIMS, the lithium distribution in LIB components can be mapped at high resolution and in 3D with relative ease.9,11,14
For 3D visualization and analysis, Avizo Software paired these two sources of data for a correlated look at the NMC811 cathode particles. Finding cracks, secondary particle agglomeration, dendritic growth, and other defects via FIB-SEM provides valuable insights for battery researchers working to enhance the safety and performance of lithium-ion batteries.
Video Credit: Thermo Fisher Scientific - Software
Watch on-demand how to automate battery quality inspection with image interpretation
References and Further Reading
- Bohnsack, R., Pinkse, J. and Kolk, A. (2021). Business models for sustainable technologies: Exploring business model evolution in the case of electric vehicles. Research Policy, 43(2), pp.284–300. https://doi.org/10.1016/j.respol.2013.10.014.
- Goodenough, J.B. and Park, K.-S. (2013). The Li-Ion Rechargeable Battery: A Perspective. Journal of the American Chemical Society, 135(4), pp.1167–1176. https://doi.org/10.1021/ja3091438.
- Ziegler, M.S. and Trancik, J.E. (2021). Re-examining rates of lithium-ion battery technology improvement and cost decline. Energy & Environmental Science, 14(4), pp.1635–1651. https://doi.org/10.1039/d0ee02681f.
- Whittingham, M.S. (2012). History, Evolution, and Future Status of Energy Storage. Proceedings of the IEEE, 100(Special Centennial Issue), pp.1518–1534. https://doi.org/10.1109/jproc.2012.2190170.
- Liu, X., et al. (2022). Bridging Multiscale Characterization Technologies and Digital Modeling to Evaluate Lithium Battery Full Lifecycle. 12(33), pp.2200889–2200889. https://doi.org/10.1002/aenm.202200889.
- Dahn, J. R., and Ehrlich, G. M. (2011) Lithium-ion batteries: Advanced materials and technologies, in Linden’s Handbook of Batteries. 4th ed. New York: McGraw-Hill.
- Liu, H., et al. (2016). Three-dimensional investigation of cycling-induced microstructural changes in lithium-ion battery cathodes using focused ion beam/scanning electron microscopy. Journal of Power Sources, 306, pp.300–308. https://doi.org/10.1016/j.jpowsour.2015.11.108.
- Hall, A.S., Lavery, L.L. and Doux, P. (2019). Effective Multimodal Multiscale Analytical and Imaging Correlation. IEEE Sensors Letters, [online] 3(1), pp.1–4. https://doi.org/10.1109/lsens.2018.2878667.
- Hovington, P., et al. (2016). Can we detect Li K X-ray in lithium compounds using energy dispersive spectroscopy? Scanning, 38(6), pp.571–578. https://doi.org/10.1002/sca.21302.
- Jiao, C., et al. (2019). Three-Dimensional Time-of-Flight Secondary Ion Mass Spectrometry and DualBeam FIB/SEM Imaging of Lithium-ion Battery Cathode. Microscopy and Microanalysis, 25(S2), pp.876–877.https://doi.org/10.1017/s1431927619005117.
- Jiao, C., et al. (2024) 3D ToF-SIMS detection of 7Li+ in NMC811 via automated FIB cross-sectioning, The 65th Battery Symposium in Japan. Available at: https://pub.confit.atlas.jp/en/event/denchi65/presentation/1B07.
- Shen, Y., Howard, L. and Yu, X.-Y. (2024). Secondary Ion Mass Spectral Imaging of Metals and Alloys. Materials, 17(2), pp.528–528. https://doi.org/10.3390/ma17020528.
- Pillatsch, L., Östlund, F. and Michler, J. (2019). FIBSIMS: A review of secondary ion mass spectrometry for analytical dual beam focussed ion beam instruments. Progress in Crystal Growth and Characterization of Materials, 65(1), pp.1–19. https://doi.org/10.1016/j.pcrysgrow.2018.10.001.
- Priebe, A. and Michler, J. (2023). Review of Recent Advances in Gas-Assisted Focused Ion Beam Time-of-Flight Secondary Ion Mass Spectrometry (FIB-TOF-SIMS). Materials, 16(5), p.2090. https://doi.org/10.3390/ma16052090.
- Thermo Fisher Scientific. Avizo Software for battery and energy materials characterization. Available at: https://www.thermofisher.com/in/en/home/electron-microscopy/products/software-em-3d-vis/avizo-software/batteries.html.

This information has been sourced, reviewed and adapted from materials provided by Thermo Fisher Scientific – Avizo Software.
For more information on this source, please visit Thermo Fisher Scientific – Avizo Software.