As a central pillar of modern society, the pharmaceutical industry bears the load of billions of lives around the world. In 2022, the global revenue of the pharmaceutical industry approximated $1.5 trillion, a figure reflected in two decades of significant growth.1
Pharmaceutical development is advanced by the continued search for new active pharmaceutical ingredients (APIs), including analogs, phytopharmaceuticals, and biopharmaceuticals, which have the potential to yield life-changing drugs. This enterprise is concomitant with an increasing trend toward designing new dosage forms and drug combinations, improving manufacturing processes, and exploring new indications for existing drugs.
Addressing the needs of the pharmaceutical industry, specifically the research, development and analysis of drugs, requires a sophisticated suite of techniques for fast and effective characterization and quality control. Thermal analysis is a family of techniques that measures the change of specific properties of materials as a function of temperature to elucidate their physical and chemical characteristics.2,3 While thermal analysis comprises numerous methods, this article will focus on three key examples: differential scanning calorimetry, thermogravimetric analysis, and sorption analysis.
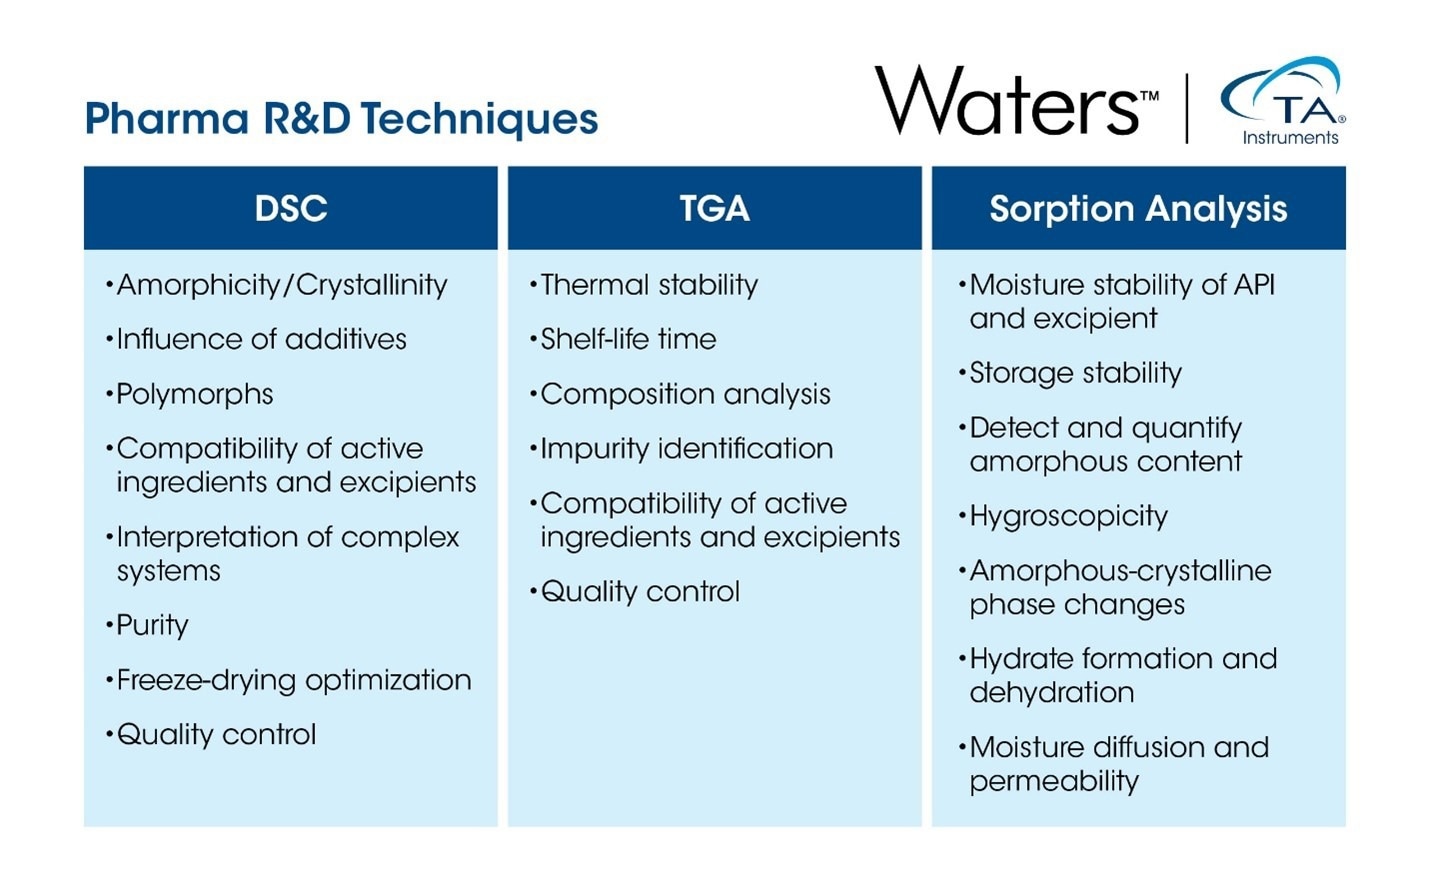
Image Credit: TA Instruments
Discussion
Thermogravimetric Analysis (TGA)
TGA determines mass changes in a sample while it is heated or maintained under isothermal conditions within a controlled atmosphere.
A TA Instruments™ Discovery™ TGA system consists of three main components: a precision weighing system, a furnace, and a device to regulate the surrounding atmosphere. During analysis, both temperature and mass are continuously recorded. Most materials exhibit mass loss when heated; however, in some cases, such as exposure to oxygen, mass gain can occur due to oxidation.
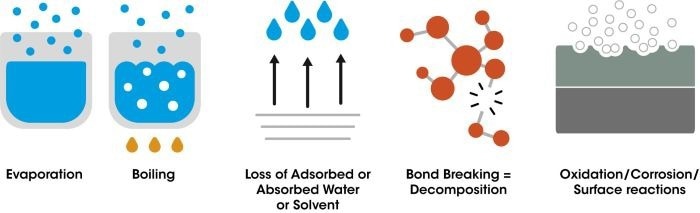
Figure 1. Possible causes of mass loss during heating. Image Credit: TA Instruments
A TGA analysis provides the following information:
- Loss of volatile fractions – water or solvent residues
- Thermal stability of materials
- Oxidative stability of materials
- Quantitative composition of multi-component systems
- Data on decomposition kinetics
- Anticipated operational lifespan
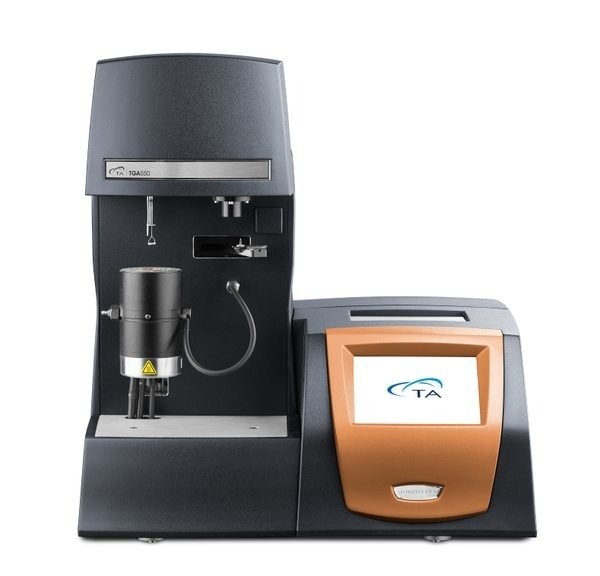
Figure 2. TA Instruments Thermogravimetric analyzer (TGA). Image Credit: TA Instruments
In a typical TGA measurement, mass loss (in %) is plotted against temperature (in °C), while the dissipation signal (shown in blue) provides additional insight into the reaction rate between different thermal events.
The peak of this derivative curve indicates the temperature at which the reaction rate is highest. Conversely, the minimum—representing the lowest reaction rate between two thermal events—is used to define the evaluation limits of consecutive decomposition stages. The curve typically begins with moisture loss, followed by multi-stage thermal decomposition.
TGA systems can also be coupled with gas analysis tools such as MS, FTIR, or GC-MS. In these setups, gases released during the experiment are carried by the purge gas to the analytical instrument, allowing for qualitative identification of volatile components and decomposition products.
Because these systems can be triggered simultaneously, data from both TGA and gas analysis can be aligned on a time scale.
Figure 4 illustrates this by overlaying the TGA curve with mass spectrometry signals corresponding to mass-to-charge ratios of 18, 36, and 43. This allows the different degradation stages to be linked to specific solvent releases.
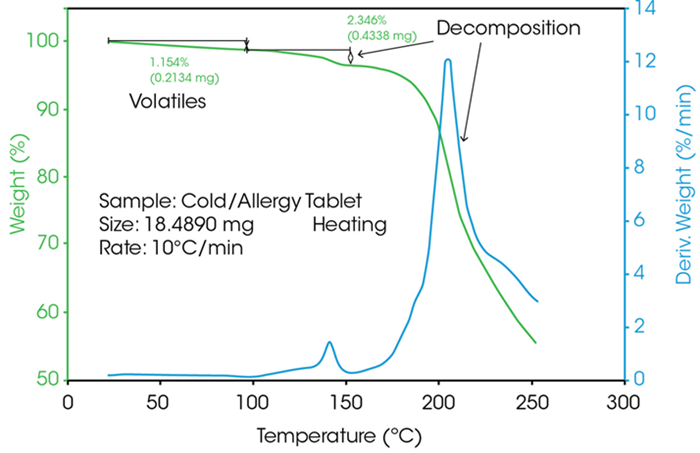
Figure 3. TGA analysis of an allergy tablet. Image Credit: TA Instruments
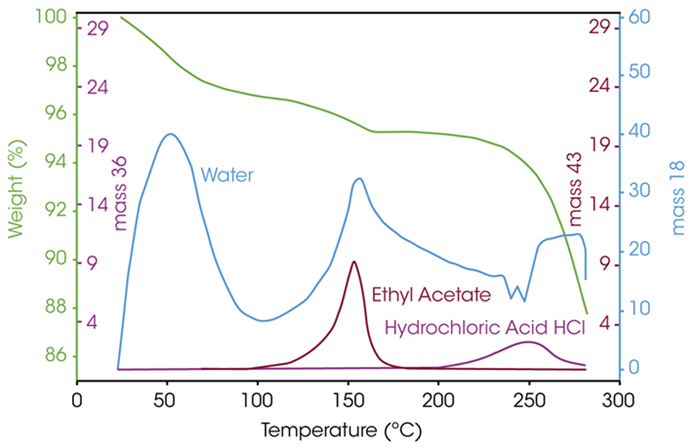
Figure 4. TGA-MS analysis for the characterization of solvents. Image Credit: TA Instruments
Sorption Analysis
The moisture content of solid dosage forms is a key parameter affecting stability. A Dynamic Vapor Sorption Analyzer (DVSA) is utilized to identify the change in mass under water (Steam/Relative Humidity) and can be characterized by:
- Adsorption (mass increase)
- Desorption (mass decrease)
Mass change is determined as a function of the relative humidity (RH) and the temperature (T). The TA Instruments Discovery SA instrument employs a double humidity chamber in place of the TGA furnace and can operate in the 5–85 °C temperature range. By mixing dry and moist gas streams, relative humidity can be set from 0–98 %.
This configuration supports analysis of different interactions with water:
- Wetting
- Drying
- Hygroscopy
- Hydrothermal stability
- Hydrate formations
- Moisture-induced structural changes
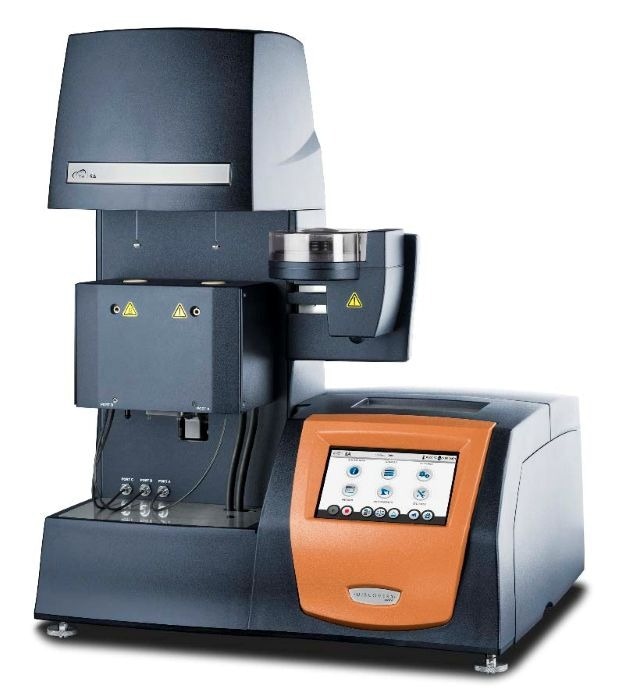
Figure 5. TA Instruments Discovery SA with double humidity chamber. Image Credit: TA Instruments
Water vapor sorption depends on the structure of the material. Chemically identical materials tend to absorb more water in an amorphous state, compared to the crystalline structure.
Water sorption can substantially decrease the glass transition temperature and trigger undesired (re-)crystallization. The physical properties of the amorphous and crystalline phases differ significantly and can impact various product attributes:
- Mechanical (pouring behavior)
- Physical (solubility)
- Chemical (stability)
- Pharmacological (bioavailability)
Sorption analysis is utilized to identify the relative humidity and temperature settings at which a material crystallizes. The amorphous lactose sample presented in Figure 6 absorbs more water at 25 °C above the glass transition, resulting in recrystallization. This information is critical for determining appropriate storage and transport conditions.
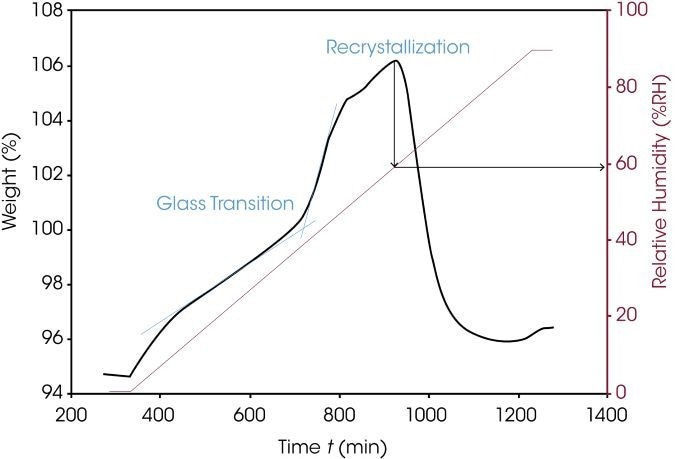
Figure 6. Water sorption of amorphous lactose. Image Credit: TA Instruments
Differential Scanning Calorimetry (DSC)
DSC determines the heat flux that is released or absorbed as a function of time, temperature, and atmosphere. It is always measured against a reference sample, typically an empty pan. Open, closed, or hermetically sealed pans are utilized as sample vessels, with aluminum pans being most frequently utilized.
Since measurements can be conducted in heating, cooling, or isotherm, DSC systems are usually combined with a cooler (compressor cooler or liquid nitrogen).
The heat flow reveals:
- Phases or structural alterations
- Chemical reactions and physical interactions
DSC can be utilized to identify material parameters, such as:
- Melting temperature
- Melting enthalpy
- Glass transition temperature
- Influence of cooling rate and storage on the formation of the amorphous and crystalline phases
- Purity determination
- Compatibility
- Polymorphism
- Denaturation
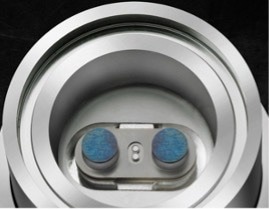
Figure 7. DSC cell. Image Credit: TA Instruments
Compatibility
Component incompatibility can impact product longevity or efficacy. Determining the individual components in comparison to a mixture of the components can provide information about this.
Magnesium stearate, commonly utilized as a lubricant in pharmaceutical tablet fabrication, is presented as an example of compatibility testing using TA Instruments Discovery DSC in Figures 8 and 9. Figure 8 compares the 50/50 mixture of aspirin and magnesium stearate with the pure materials. Each of the individual components exhibits an endothermic melting peak.
A compatible mixture would display two melting peaks of proportional size in the same temperature window. However, the mixture reveals two endothermic effects at substantially lower temperatures, clearly indicating incompatibility.
To evaluate material compatibility at room temperature or below their melting points, material heat capacity can be determined as a single substance and, in comparison, as a mixture instead of the heat flow. Modulated DSC™ (MDSC™) experiments provide significant benefits here.
This method, which does not rely on sinusoidal temperature oscillation, allows for the isothermal determination of heat capacity (Cp). Figure 9 shows the stable Cp curves of each substance, recorded over time at a constant temperature of 50 °C.
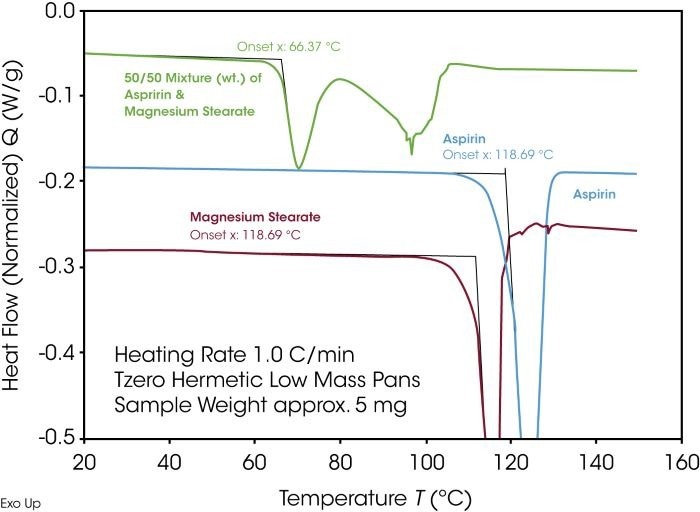
Figure 8. Compatibility check using DSC. Image Credit: TA Instruments
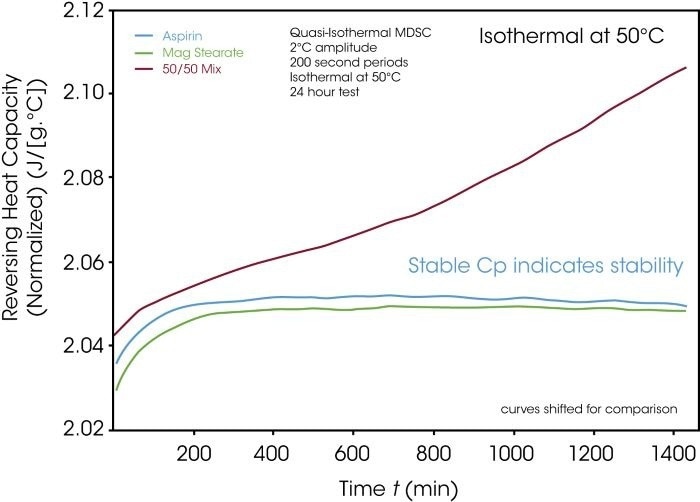
Figure 9. Quasi-isothermal Cp determination to test compatibility. Image Credit: TA Instruments
Glass Transition
An important aspect of pharmaceutical material analysis is identifying the glass transition using DSC.
The proportion of the amorphous phase in an active pharmaceutical ingredient (API) or finished product significantly affects characteristics like tabletability, solubility, and, ultimately, the drug’s release rate and bioavailability. However, amorphous and semi-amorphous substances are thermodynamically unstable and prone to recrystallization.
Humidity can lower the glass transition temperature (Tg) below ambient conditions, potentially triggering crystallization. This may result in the formation of polymorphic forms or hydrates, as well as particle agglomeration.
Moisture uptake can also impact the physical properties of the dosage form. In a DSC measurement, the glass transition appears as a step-like change in the heat flow signal. Both the onset temperature and the height of this step are critical, as shifts in these values can reveal information about the material’s amorphous content.
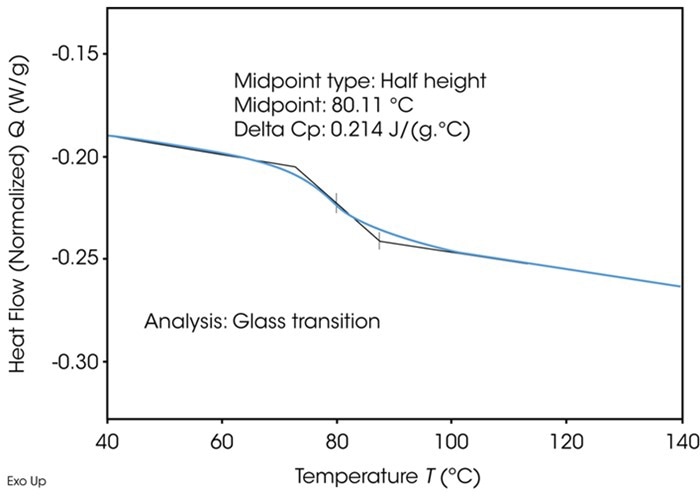
Figure 10. Typical glass transition determined by DSC. Image Credit: TA Instruments
Summary
Thermal analysis techniques such as TGA, SA, and DSC provide powerful tools for evaluating the material properties of active pharmaceutical ingredients, carrier substances, and finished products. These methods are especially advantageous in research settings where only small sample quantities are available, as they require minimal material for testing.
Compared to many other analytical approaches, DSC and TGA offer relatively fast analysis times, allowing researchers to obtain meaningful data within short measurement intervals.
Acknowledgments
Produced from materials originally authored by Monika Schennen.
References and Further Reading:
- Mikulic, M. (2023). Global pharmaceutical industry – statistics & facts. Statista. Available at: https://www.statista.com/topics/1764/global-pharmaceutical-industry/#topicOverview (Accessed on 01 October 2023).
- Stodghill, SP. (2010). Thermal Analysis – A Review of Techniques and Applications in the Pharmaceutical Sciences. American Pharmaceutical Review. Available at: https://www.americanpharmaceuticalreview.com/Featured-Articles/36776-Thermal-Analysis-A-Review-of-Techniques-and-Applications-in-the-Pharmaceutical-Sciences/
- Duncan, QM., et al. (2006). Thermal Analysis of Pharmaceuticals. CRC Press: Taylor & Francis Group.

This information has been sourced, reviewed and adapted from materials provided by TA Instruments.
For more information on this source, please visit TA Instruments.