Lithium-ion batteries power everything from our portable electronics and electric vehicles to vital medical equipment and renewable energy storage. As the market expands, researchers are finding ways to make Li-ion batteries increasingly powerful, dependable, and safe, all while minimizing production time and cost.
Since its development in the 1990s, Lithium Iron Phosphate (LFP) has become a popular cathode material for lithium-ion batteries (LIB). Among its advantages, LFP is cost-effective, long lasting, and is one of the safest cathode material options available. It offers great thermal stability and excellent electrochemical properties, but its low electrical conductivity has led to ongoing efforts to optimize its performance.
One of the strategies used is to modify the surface of the LFP through a carbon (C) coating; however, the source of carbon can influence performance, as well as coating thickness. If the coating is too thick, it can hinder diffusion of lithium ions and decrease the energy density of the battery. As a result, an LFP/C composite material with optimized carbon source and loading is desired for high performance.1 Other strategies include modifying LFP morphology or doping the material to improve electrical conductivity. Understanding the phase transition temperature and heat flow properties can help optimize the process, while also gaining insight into the effects of any material modifications. Oxidation can readily occur in LFPs and care needs to be taken in the process to avoid this.2, 3
Formulators and manufacturers need efficient means to verify the carbon content and integrity of their coatings, check for oxidation conditions, and understand the phase transition behavior. Differential scanning calorimetry (DSC) can be coupled with thermogravimetric analysis (TGA) to evaluate coated LFP.
Differential Scanning Calorimeters (DSC) measure the heat absorbed or released when a sample material is heated, cooled, or held isothermal. The heat flow is determined by comparing the heat flow difference between a sample material and a reference. DSC provides insights into the battery material’s heat capacity and phase transitions such as melting point (Tm), heat of fusion, and glass transition (Tg).
Thermogravimetric Analyzers (TGA) programmatically heat up a material while measuring its mass change with a highly sensitive analytical balance. Loss of mass indicates possible decomposition or vaporization, while a gain in mass represents possible sorption or that the material is reacting with its gaseous surroundings. Battery developers turn to TGA to quantify oxidation, thermal degradation, and thermal stability. TGA elucidates the temperatures at which battery materials start to degrade, empowering researchers to choose proper materials and build high performing, long-lasting batteries.
Simultaneous DSC-TGA (SDT) measures both weight changes and heat flow in a material as a function of temperature or time in a controlled atmosphere up to 1500 °C. In this paper, SDT will be used to identify the composition of carbon coating on LFP from the weight change, determine the phase transition temperature, and the enthalpy of reaction during phase transitions from the heat flow data. X-ray diffraction (XRD) will be done to further investigate LFP oxidation and crystalline structure.
Experiment
Commercially sourced carbon-coated LFP powder was provided by NEI Corporation. For comparison, uncoated reference LFP was obtained from Sigma-Aldrich to evaluate coating degradation and phase transitions.
Weight loss and heat flow data for both materials were collected under nitrogen using a TA Instruments SDT 650 (Figure 1). To assess the effect of different atmospheric conditions, the coated NEI samples were also tested under argon and air purge gases.
Samples were heated from room temperature to 1200 °C at a rate of 20 °C/minute. Both alumina and sapphire pans were used, with sapphire pans recommended for experiments above the melting point to prevent adhesion to the SDT beam.
To complement the SDT results, XRD was performed to analyze changes in the crystalline structure of coated LFP after high-temperature exposure. Two annealing experiments were carried out under different environmental conditions.
In the first experiment, LFP powders were annealed in a muffle furnace by heating to 350 °C at a rate of 5 °C/minute, maintained at that temperature for two hours, then cooled at a rate of 10 °C/minute.
The second set of powders were annealed in a nitrogen atmosphere by placing the powders in a tube furnace. This tube furnace was pre-flowed with nitrogen gas for 30 min at a rate of 200 mL/min to eliminate any residual air. The powders were then heated to 950 °C at a rate of 5 °C/minute, kept at temperature for two hours, and cooled to room temperature at a rate of 10 °C/minute.
Both pristine and annealed samples were analyzed by NEI Corporation using a MiniFlex II XRD system from Rigaku Corporation to evaluate structural stability.
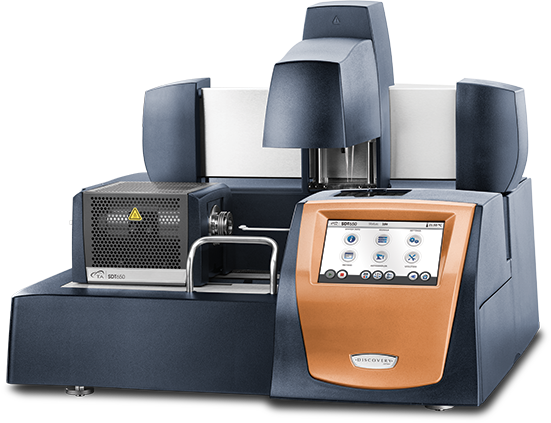
Figure 1. TA Instruments SDT for simultaneous DSC and TGA measurements at high temperatures. Image Credit: TA Instruments
Results and Discussion
Figure 2 illustrates the coating content of the commercial LFP cathode samples in nitrogen.
Coated LFP cathode (blue) exhibited a 3 % weight loss, while the uncoated LFP (green) showed negligible weight loss. Consequently, the coated LFP cathode material (blue) loses 3 wt% of the organic coating, with the remaining 97 % of the material constituting LFP.
Both LFP samples displayed an endothermic peak melting transition near 970 ˚C.4 The coated LFP cathode exhibited both coating decomposition and LFP phase transition across the same temperature range. For improved precision in enthalpy values, the endothermic heat flow was plotted as weight-corrected heat flow to obtain the weight-adjusted enthalpy value.
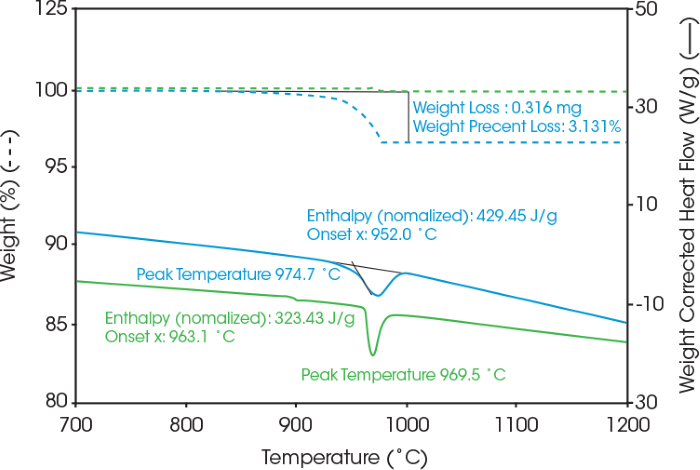
Figure 2. Weight change and heat flow of LFP samples from coated (Blue) and reference uncoated (Green) under nitrogen. Image Credit: TA Instruments
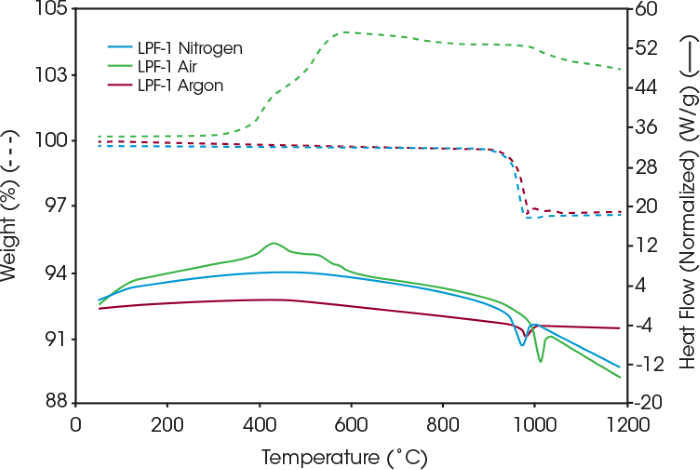
Figure 3. Coated LFP thermal stability under nitrogen, air, and argon. Image Credit: TA Instruments
In addition to the nitrogen environment, samples were run in air and argon to assess stability and interactions with those gases. Figure 3 presents the resulting heat flow and weight loss of the coated LFP in air, nitrogen, and argon atmospheres. In nitrogen and argon, the coated LFP remains stable until the sample temperature exceeds 900 °C, at which point the coating begins to degrade.
The coated LFP sample in air exhibits an exothermic reaction peak near 432 °C, along with a weight increase beginning around 300 °C, likely attributable to oxidation. As indicated in Table 1, the peak temperature of the coated LFP is 975 °C in nitrogen and 982 °C in argon.
Table 1. Endotherm peak temperature and weight loss of the coated LFP under nitrogen, air, and argon. Source: TA Instruments
| Purge Gas |
Peak Temperature of Endotherm (°C) |
Weight Loss (%) |
| Nitrogen |
975 |
3.13 |
| Air |
993 |
– |
| Argon |
982 |
3.05 |
SDT enables rapid first pass screening of the temperature stability of LFP. These findings can guide the selection of annealing settings for XRD analysis to assess alterations in LFP crystalline structure after exposure to elevated temperatures. Coated LFP specimens were annealed under nitrogen at 950 °C, where an endothermic phase transition begins in Figure 2.
Additional coated LFP samples were annealed in air at 350 °C due to the observed weight gain around this temperature in Figure 3. This weight increase suggests potential oxidation, and SDT evaluation can be utilized to identify the onset temperature of this reaction. The first derivative weight signal plotted in Figure 4 reveals the rate of weight gain, showing an onset at 325 °C.
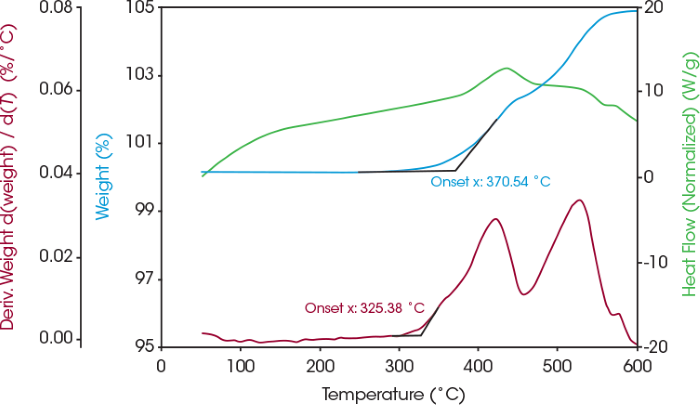
Figure 4. Weight change (blue), heat flow (green), and derivative of weight change (red) of coated LFP in air. Image Credit: TA Instruments
Oxidation was verified by the corresponding XRD experiment, illustrated in Figure 5. The impurity phase forms when powders are annealed in air, indicating an oxidation reaction between the coated LFP powders and atmospheric oxygen at 350 °C. No impurity phases were detected in powders annealed under nitrogen.
However, the peaks appear to broaden, which may indicate thermally induced lattice distortion.5 This broadening could be associated with subtle changes in the crystal structure caused by annealing at 950 °C—the temperature at which a phase transition begins, as suggested by the SDT data shown in Figure 2.
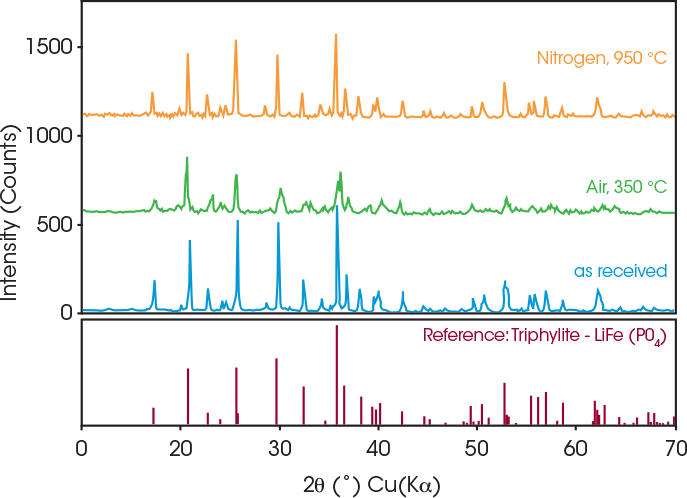
Figure 5. XRD analysis of coated LFP annealed under nitrogen at 950 °C (orange), air at 350 °C (green), as received (blue), and reference LFP (maroon). Image Credit: TA Instruments
Conclusions
The TA Instruments SDT is a valuable tool for evaluating the thermal stability and phase transitions of active materials used in lithium-ion battery cathodes. It allows for the investigation of reaction temperatures, energy release, weight changes, and material interactions with various atmospheres, including air, nitrogen, and argon.
In this study, the LFP sample was found to contain approximately 3 wt% of organic coating material. The sample remained stable in nitrogen and argon environments up to 900 °C.
In contrast, samples exposed to air began to oxidize at 370 °C and exhibited a higher phase transition temperature thereafter. This oxidation behavior was further confirmed through XRD analysis.
Beyond providing insights into cathode stability, SDT data can also be used to examine the crystalline structure of LFP at key temperatures, such as those associated with oxidation or phase transitions.
Acknowledgments
Produced from materials originally authored by Jennifer Vail, Ph.D., and Andrew Janisse, Ph.D., Application Specialists at TA Instruments and Hang Lau, Ph.D., New Market Development Scientific Lead at TA Instruments in collaboration with NEI Corporation (Somerset, New Jersey).
References and Further Reading:
- Avci, E. (2014). Enhanced cathode performance of nano-sized lithium iron phosphate composite using polytetrafluoroethylene as carbon precursor. Journal of Power Sources, (online) 270, pp.142–150. https://doi.org/10.1016/j.jpowsour.2014.07.046.
- Ahsan, Z., et al. (2020). Recent Progress in Capacity Enhancement of LiFePO4 Cathode for Li-Ion Batteries. Journal of Electrochemical Energy Conversion and Storage, 18(1). https://doi.org/10.1115/1.4047222.
- Kretschmer, K. (2018). Phosphate-Based Cathode Materials for Rechargeable Batteries. (online) Available at: https://opus.lib.uts.edu.au/bitstream/10453/127908/2/02whole.pdf (Accessed 11 Jun. 2025).
- Gauthier, M. et al. (2010) Melt Casting LiFePO(sub 4), Journal of the Electrochemical Society, 157(4), p. A453. https://doi.org/10.1149/1.3284505.
- Ungár, T. (2004). Microstructural parameters from X-ray diffraction peak broadening. Scripta Materialia, (online) 51(8), pp.777–781. https://doi.org/10.1016/j.scriptamat.2004.05.007.

This information has been sourced, reviewed and adapted from materials provided by TA Instruments.
For more information on this source, please visit TA Instruments.