The use of recycled polymer materials is steadily increasing, as manufacturers look for ways to substitute virgin polymers with recycled feedstock. To ensure that this shift doesn't compromise product performance, it's essential to characterize the recycled polymers and compare their properties against their virgin counterparts.
One effective method is thermogravimetric analysis (TGA), which can predict a material’s lifespan and help prevent premature failure.
This study investigates the degradation kinetics of both virgin and recycled polyethylene terephthalate (PET) fibers used in 3D printing, using TGA. Results show that the lifetime predictions for the two types of samples are closely aligned.
Introduction
The widespread presence of plastics in the environment has prompted consumers, governments, and companies to seek more sustainable and renewable alternatives.
PET is one of the most commonly used polymers, especially in plastic bottles and packaging across a range of industries.
Due to its extensive use, PET is a major component of plastic waste streams. Fortunately, it’s also among the easiest polymers to recycle.1
Polymer recycling, however, is a multifaceted process involving primary, secondary, and tertiary techniques.
Primary recycling involves the reuse of uncontaminated, discarded polymer without significant processing. Secondary recycling—also known as mechanical recycling—entails physically reprocessing the material while preserving its chemical structure. Tertiary or chemical recycling uses processes such as pyrolysis or hydrolysis to break down the polymer into its basic chemical components.2,3
Of these, mechanical recycling is the most widely adopted, although it comes with concerns, particularly regarding polymer degradation over time and potential declines in material performance.3
As a result, it’s essential to evaluate material properties and performance when working with recycled PET (rPET) feedstock. Prior research has focused on characterizing rPET in applications such as honeycomb structures, as well as using rheology to assess melt stability and optimize processing conditions.4,5
Another key consideration when using rPET is understanding its degradation kinetics in comparison to virgin PET.
TGA offers an efficient alternative to oven aging for studying degradation. TGA tracks weight changes in a material as it's heated at controlled rates, capturing decomposition behavior. The resulting data can be used to estimate a material’s projected lifespan and provide insights into its degradation kinetics.6
Experimental
This study examined and compared the degradation kinetics of PET and rPET filaments used in 3D printing.
Commercially sourced samples from a single manufacturer were analyzed. Key degradation kinetic parameters—activation energy and projected lifetime—were determined using TGA following the Flynn/Wall/Ozawa isoconversional method, as outlined in ASTM E1641.7
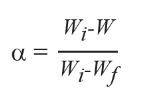
In TGA kinetic evaluation, the conversion (α) of a sample refers to the ratio of actual mass loss to the total mass loss during the degradation process. This value is calculated using Equation 1.
 |
1 |
Where:
- W = sample weight at any point during the degradation
- Wi = initial weight
- Wf = final weight
The conversion level may differ from the percent weight loss of a sample run in TGA when residue from nonreactive fillers or char is present. In the Flynn/Wall/Ozawa method, the temperatures in the degradation profile at specific conversion levels for several ramp rates are documented. These are considered the isoconversional temperatures for every conversion level and ramp rate.
After identifying the isoconversional temperatures, plots can be generated to determine activation energy, expected lifetime, and the relative thermal index (RTI). The RTI is the highest service temperature where a critical material property, such as degradation percent, remains above a defined critical threshold over an extended period. This index can be used as a comparison of the thermal endurance of multiple materials.
Measurements were conducted using a TA Instruments™ Discovery™ TGA 5500 with 7 mg (± 1 mg) samples in platinum pans. The samples were heated through decomposition from room temperature to 800 °C under nitrogen purge.
For this study, five different heating rates were utilized: 1 °C/minute, 2 °C/minute, 5 °C/minute, 10 °C/minute, and 20 °C/minute.
Results and Discussions
Figure 1 shows the weight loss profiles of PET and rPET at five different heating rates. Each of these thermal curves can be used to determine the absolute temperature at a constant conversion.
It is worth noting that, due to the inert environment, char residue remains from each sample; however, it is accounted for in the conversion percentage calculation.
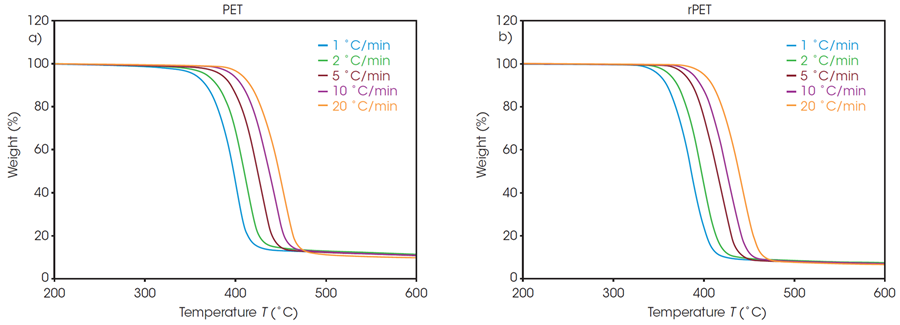
Figure 1. Weight loss profiles of a) PET, and b) rPET. Image Credit: TA Instruments
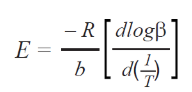
Plots of the logarithm of the heating rate versus the reciprocal of the isoconversional temperatures, shown in Figure 2, are used to calculate activation energy. The slopes of these curves are applied in Equation 2 to iteratively determine the activation energy at each conversion level, following the approach outlined in previous studies.6
 |
2 |
Where:
- E = activation energy (J/mol)
- R = gas constant (8.314 J/mol K)
- T = temperature at constant conversion (K)
- b = heating rate (K/min)
- b = constant, approximation derivative (0.457) [ASTM E1641-18]
A “Log Heating Rate” curve can provide valuable insight when analyzing decomposition of a polymer sample. Uniform decomposition mechanisms at all isoconversion levels result in parallel lines with equivalent slopes. At low conversion levels, the slopes may not match due to weight loss from small volatiles escaping the system.
Consequently, analyzing decomposition activation energy is more common at slightly higher conversion levels, where weight loss can be more reliably attributed to sample thermal degradation. A frequently selected conversion level is 5 %.
At a 5 % conversion level, the activation energy for the thermal degradation of PET and rPET is determined to be 210.6 and 213.9 kJ/mol, respectively. This indicates that the polymer degradation is the same for both batches, regardless of whether the material is recycled or virgin.
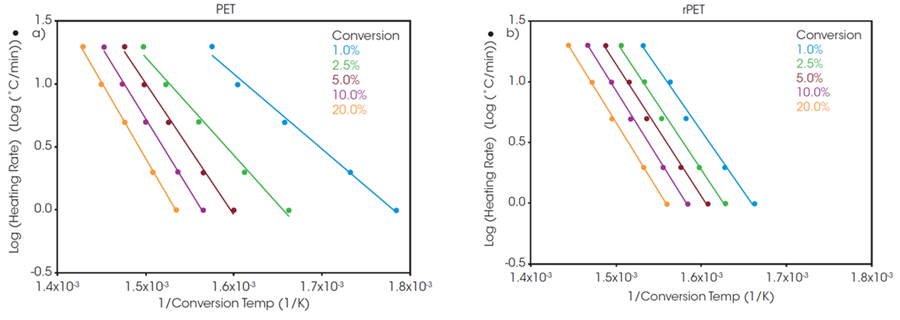
Figure 2. Log Heating Rate vs Conversion Temperature of a) PET, and b) rPET. Image Credit: TA Instruments
The calculated activation energy enables determination of lifetime thermal stability as described in ASTM E1877.8 The resulting plots are illustrated in Figure 3, predicting material thermal stability as a function of time and temperature.
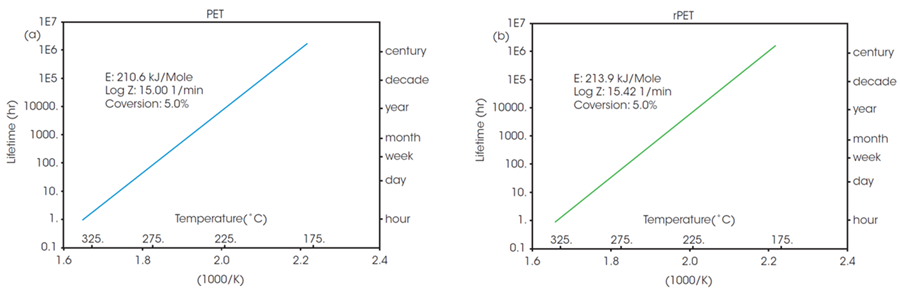
Figure 3. Estimated lifetime (log scale) vs reciprocal of the failure temperature of a) PET, and b) rPET. Image Credit: TA Instruments
The RTI for multiple materials can be established by choosing a common thermal lifetime and determining the failure temperature (Tf) for each system to reach the designated conversion over the specified lifetime. Based on Figure 3, the failure temperature for PET to reach 5 % conversion over a five-year period (43800 hours) can be calculated as 208 °C.
The RTI of rPET is functionally the same, calculated as 206 °C over the same lifetime. This shows that products manufactured using material sourced from this recycled feedstock will exhibit the same thermal stability over their lifespan as those manufactured with the virgin material.
Conclusion
A TA Instruments Discovery TGA 5500 was used to predict the lifetime thermal stability of PET and rPET. Several dynamic heating ramps were applied to each sample to identify the kinetic parameters of thermal decomposition by the Flynn/Wall/Ozawa isoconversional method.
The sample composed of recycled feedstock demonstrated thermal stability and lifetime performance comparable to that of the virgin material sample. It is worth noting that, in this case, switching to a more sustainably sourced material does not alter predicted thermal stability.
References and Further Reading:
- Schyns, Z.O.G. and Shaver, M.P. (2020). Mechanical Recycling of Packaging Plastics: a Review. Macromolecular Rapid Communications, (online) 42(3), p.2000415. https://doi.org/10.1002/marc.202000415.
- Thiounn, T. and Smith, R.C. (2020). Advances and approaches for chemical recycling of plastic waste. Journal of Polymer Science, (online) 58(10), pp.1347–1364. https://doi.org/10.1002/pol.20190261.
- Jones, M.D. and Payne, J. (2021). The Chemical Recycling of Polyesters for a Circular Plastics Economy: Challenges and Emerging Opportunities. ChemSusChem, 14(19). https://doi.org/10.1002/cssc.202100400.
- E. Verdonck, “TA444: Comparison of the thermal behavior of different types of recycled PET for advanced honeycomb structures”,” TA Instruments, New Castle, DE. TA444.pdf
- T. Chen, “RH122: Using Rheology and Thermal Analysis to Help Optimize Processing Conditions of Recycled PET,” TA Instruments, New Castle, DE, 2022. Rheology: Optimizing Processing Conditions of Recycled PET
- Y. Sanchez, “TA125: Estimation of Polymer Lifetime by TGA Decomposition Kinetics,” TA Instruments, New Castle, DE. TA125.pdf
- “ASTM E1641-18, Standard Test Method for Decomposition Kinetics by Thermogravimetry Using the Ozawa/Flynn/Wall Method,” ASTM International, West Conshohocken, PA, 2018. E1641 Standard Test Method for Decomposition Kinetics by Thermogravimetry Using the Ozawa/Flynn/Wall Method
- “ASTM E1877-21 Standard Practice for Calculating Thermal Endurance of Materials from Thermogravimetric Decomposition Data,” ASTM International, Conshohocken, PA, 2021. E1877 Standard Practice for Calculating Thermal Endurance of Materials from Thermogravimetric Decomposition Data
Acknowledgments
Produced from materials originally authored by Andrew Janisse, PhD and Jennifer Vail, PhD at TA Instruments.

This information has been sourced, reviewed and adapted from materials provided by TA Instruments.
For more information on this source, please visit TA Instruments.