Polymers are crucial across multiple sectors, including food packaging, tire fabrication, adhesives, and medical‑grade plastics. Photothermal atomic force microscope‑based infrared spectroscopy (AFM‑IR) enables nanoscale chemical characterization and is especially advantageous for examining polymers thanks to their large thermal expansion coefficients.
This article highlights the broad use of AFM‑IR in polymer studies, including polymer species identification, polymer component quantification, and characterization of functional polymeric materials. The data obtained from AFM‑IR research offers critical insights into the chemical compositions, distributions, and characteristics of polymers, supporting the advancement of improved polymer formulations and structures with micro‑ and nanoscale characteristics.
Photothermal AFM‑IR Technology
The invention of photothermal AFM-IR has transformed polymer research by combining the high spatial resolution of AFM with the chemical identification abilities of IR spectroscopy, enabling nanoscale chemical characterization.
AFM‑IR functions by mechanically identifying the excitation of an AFM probe caused by the thermal expansion of a sample upon IR absorption.1 Polymers' relatively large thermal expansion coefficients result in strong AFM‑IR signals, making them well-suited for this method.
AFM‑IR has enabled the characterization of a large spectrum of polymeric materials, including multi‑layer films, polymer blends and composites, thin films and coatings, polymer fibers, polymer nanostructures, and biodegradable polymers.
The demand for improved polymer performance in these areas continues to drive innovation in polymeric formulations and structures with micro‑ and nanoscale properties.
Offering elevated detection sensitivity (<1 nm thickness on non‑metal substrates) and sub‑5 nm lateral resolution, Bruker’s photothermal AFM‑IR technology has demonstrated remarkable effectiveness in detecting and mapping chemical compositions in polymer blends. It has also been used to identify local variations in crystallinity and their impacts on macroproperties, differentiate between surface and bulk behaviors of advanced polymers, comprehend nanoscale bonding mechanisms in polymer‑metal complexes, and more.2
Identification of Polymer Species on the Nanoscale
Each polymer displays distinct characteristic absorption bands in the IR fingerprint region, facilitating polymer species identification. Photothermal AFM‑IR spectroscopy strongly correlates with traditional Fourier transform infrared spectroscopy (FTIR). The AFM‑IR spectra generated on Bruker’s nanoIR and Dimension IconIR® systems can be imported into FTIR libraries for digital searches, enabling nanoscale chemical identification.
Polymers and their distributions have been identified via AFM‑IR in a variety of samples, such as polymer blends, polymer components in hybrid materials, including printing ink and automobile tires, polymer contaminants on semiconductor wafers, polymers in asteroids, meteorites, shale rocks, and bitumen, and drinking water.3,4
Data obtained from AFM‑IR measurements delivers valuable insights for identifying polymeric species and guiding enhancements in polymeric products' production and engineering processes.
Figure 1 shows the AFM‑IR results of a polymer blend comprising three components:
- Polystyrene (PS)
- Polymethyl methacrylate (PMMA)
- Polyvinylpyrrolidone (PVP)
The topography image in Figure 1a exhibits distinct phases, including bright circular domains roughly 1 μm in diameter and 500 nm in height and smaller domains down to 20 nm in diameter and 5 nm in height.
Circular shallow holes with depths of only a few nanometers and diameters ranging from 300 nm to 1.4 μm are less noticeable. The third phase consists of a flat, continuous matrix.
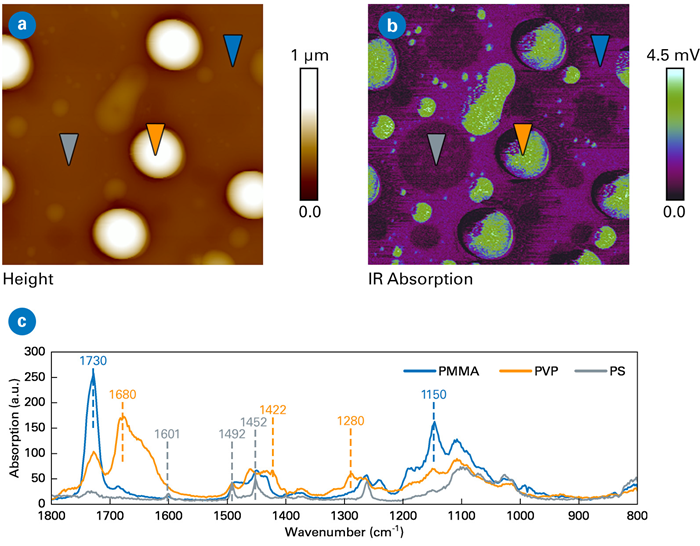
Figure 1. AFM‑IR data from a PS‑PMMA‑PVP blend. Scan sizes 5x5 μm. a) Topography image, b) IR absorption image at 1422 cm‑1, c) AFM‑IR spectra. Sample courtesy of Philippe LeClere, University of Mons, Belgium. Image Credit: Bruker Nano Surfaces and Metrology
Quantification of Polymer Composites
A key factor in polymer blends is the percentage of each component across different domains, as the chemical composition significantly influences the overall performance of the blend. AFM-IR enables scientists to utilize bulk FTIR to calibrate their data and obtain quantitative information on mass mixtures.
Groundbreaking research by Su and colleagues highlighted the ability of AFM‑IR spectroscopy to quantify the concentrations of polyethylene (PE) and polypropylene (PP) components within the three nanoscale domains—matrix, intermediate layer, and core—of high‑impact polypropylene (HIPP).5
In a separate study, AFM‑IR spectroscopy was utilized to quantify interface thickness and diffusion gradient across a polyamide/polypropylene (PA/PP) laminate interface.6
More recently, an investigation applied AFM‑IR to quantify drug loading in polymeric nanoparticles.7 In this study, Poly(lactic acid) (PLA) nanoparticles served as nanocarriers of Re(I) tricarbonyl‑diselenium, an anticancer therapeutic. As shown in Figure 2a, the topography image displays PLA nanoparticles ranging from tens to a couple of hundred nanometers in size.
Researchers established a calibration curve using standard IR microspectroscopy with PLA/drug homogeneous films of known compositions to investigate drug loading and distribution within individual nanoparticles. Local AFM‑IR spectra and IR mappings of PLA and the drug were subsequently acquired for individual nanoparticles.
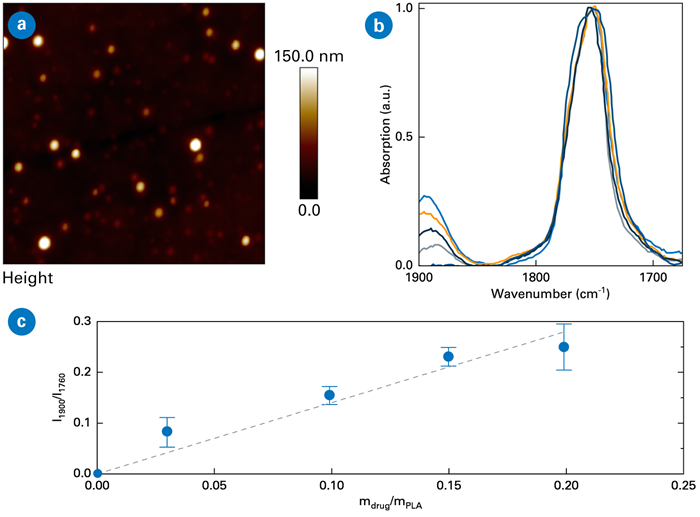
Figure 2. AFM‑IR quantification of drug loading in PLA nanoparticles. a) Topography (scan size 7x7 μm), b) AFM‑IR spectra showing characteristic IR peaks, c) intensity ratio of IR bands at 1900 and 1760 cm‑1 as a function of the drug‑to‑PLA weight ratio. Image Credit: Bruker Nano Surfaces and Metrology
Characterization of Functional Polymeric Materials
AFM‑IR has been utilized to characterize a variety of functional polymers, offering valuable insights into their nanoscale chemistry‑structure‑property relationships. Such information is crucial for enhancing current polymer fabrication processes to improve performance and designing new polymers with tailored functionalities. The following three examples illustrate a small sampling of the many common applications of AFM‑IR.
Biodegradable Polymers
Biodegradable polymers, such as polylactic acid (PLA), have the potential to serve as sustainable alternatives to standard fossil‑based polymers. The high crystallinity of pure PLA impedes foaming, which is essential for applications such as insulation and cushioning. Blending PLA with other polymers, including biodegradable poly(3‑hydroxybutyrate‑co‑3‑hydroxyvalerate) (PHBV), is a viable method to enhance its foaming behavior.
AFM‑IR was utilized to examine this biodegradable polymer blend's morphology, inhomogeneous distribution, and associated foaming and crystallization behavior, with PHBV content varying from 0 to 40%.8
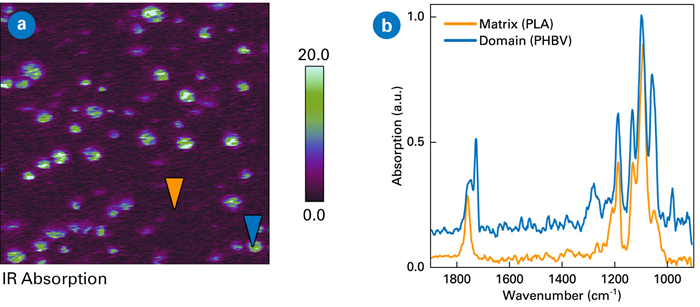
Figure 3. AFM‑IR characterization of PLA/PHBV blend with 10% PHBV. Scan sizes 5x5 μm. a) IR ratio image of 1750 and 1760 cm‑1, b) AFM‑IR spectra measured at positions indicated in the phase image. Image Credit: Bruker Nano Surfaces and Metrology
These findings carry important implications for understanding the characteristics of PLA/PHBV blends, especially their crystallization and foaming behavior. At low PHBV content, the PLA matrix hinders the crystallization of small PHBV domains. However, this effect diminishes as PHBV content increases. A higher PHBV content results in an increased complex modulus, which negatively impacts foaming. As a result, the foam morphology at elevated PHBV content displays increased density, greater cell and nucleation densities, and reduced cell sizes.
Ferroelectric Polymers
Ferroelectric polymers, such as poly(vinylidene fluoride) (PVDF) and its binary and ternary copolymers, have valuable applications in reconfigurable electronic devices. AFM‑IR has been applied to examine P(VDF‑TrFE), which is characterized by a dominant crystalline β phase with an all‑trans conformational sequence.9 This study, published in Science, confirmed that the P(VDF‑TrFE) polymer forms a concentric toroidal polar topology.
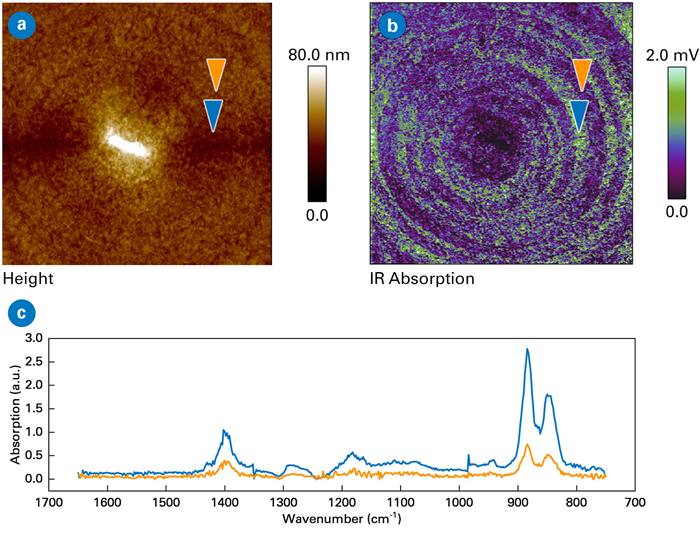
Figure 4. AFM‑IR measurements of P(VDF‑TrFE). Scan sizes 10x10 μm. a) Topography image, b) AFM‑IR absorption image at 880 cm-1 exhibiting toroidal polar topology for the lamellae, c) AFM‑IR spectra measured at neighboring bands marked by arrows in the absorption image. Image Credit: Bruker Nano Surfaces and Metrology
AFM‑IR spectra obtained from the P(VDF‑TrFE) lamellae exhibited distinct IR absorption bands, including one at 880 cm‑1 corresponding to the symmetric stretching of the CF2 group. At this wavenumber, the IR absorption image showed a spatially alternating pattern consistent with the toroidal topology, as illustrated in Figure 4.
This topology formation arises from the effective alignment of the P(VDF‑TrFE) lamellar crystals, where their interchain dipoles are oriented perpendicular to the polymer chains. A spatially periodic absorption pattern was observed when IR polarization was parallel to the film plane. This pattern formed due to the continuous variation in local absorptions of face‑on lamellae, caused by the alternating toroidal ferroelectric polarizations.
Bonding Mechanism in Metal‑Plastic Hybrids
Metal‑plastic hybrids have garnered considerable attention in engineering fields thanks to the increasing demand for weight reduction. Establishing direct bonding between metal and plastic is especially advantageous in such hybrids. A recent investigation employed the AFM‑IR method to analyze the aluminum/polyamide 6 (PA6) hybrid, presenting direct evidence of strong hydrogen bonding formation at the interface.10
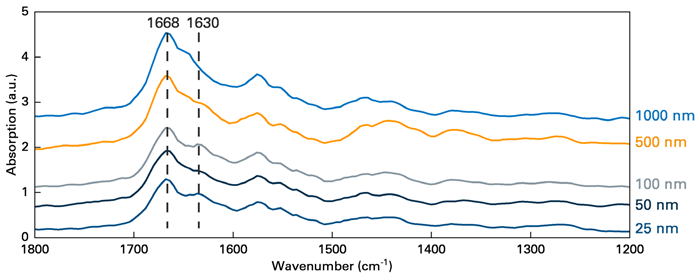
Figure 5. AFM‑IR spectra collected from the Al/PA6 interface, which showed an additional peak at 1630 cm‑1 due to hydrogen bonding formation. Image Credit: Bruker Nano Surfaces and Metrology
In this investigation, researchers hydroxylated the aluminum plate to form an amorphous AlOOH structure on its surface prior to merging with PA6 through injection insert molding. AFM‑IR spectra were acquired from five locations (Figure 5), including three within the bonding region, each roughly 100 nm in size, and two in the PA6 bulk.
Although all spectra exhibited the free C=O stretching band of PA6 at 1668 cm‑1, the spectra from the bonding region exhibited an additional peak at 1630 cm‑1. This feature was attributed to the hydrogen‑bonded C=O stretching of PA6, suggesting hydrogen bonding between the amorphous AlOOH and PA6. These hydrogen bonds strengthen the adhesion between the aluminum plate and the PA6 polymer.
Correlative Study of Polymer Blends
When integrated with other AFM modes, the chemical identification ability of AFM‑IR can be correlated with topographical, mechanical, and electrical data, providing a more thorough characterization of polymeric samples. Bruker's AFM‑IR platforms include AFM modes such as PeakForce Tapping®, enabling correlative measurements at the same sample locations, either concurrently or sequentially. This robust correlative methodology offers unprecedented insights into sample characteristics.
Various polymeric samples have been investigated via correlative AFM and AFM‑IR modes. The chemical, mechanical, and electrical images of a PS/PE polymer blend are displayed in Figure 6. IR mapping at 1464 cm‑1, corresponding to the ‑CH2‑ bending mode, identifies the circular domain as PE, while the PS matrix demonstrates greater absorption at 1492 cm‑1 from its aromatic ring stretch.
Mechanical mapping reveals that the PE domains demonstrated elevated adhesion with some fine structures, along with lower modulus. Kelvin probe force microscopy (KPFM) electrical mapping indicates that PE possesses higher potential and lower dielectric. These complementary methods provide a multifaceted understanding of the sample.
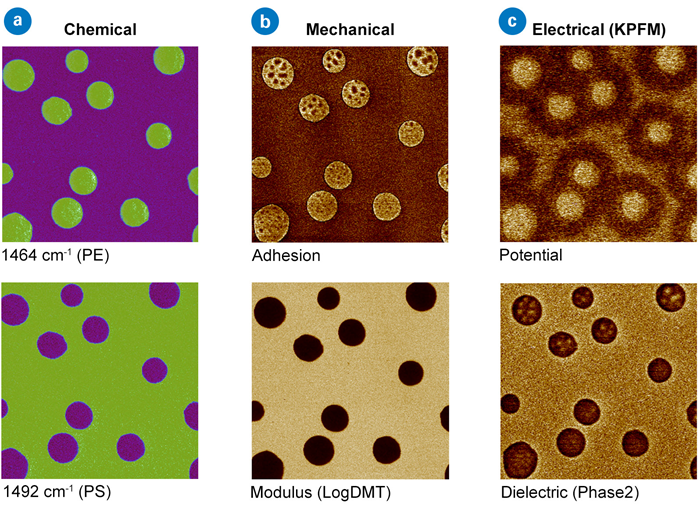
Figure 6. Correlative study of PS/LDPE, providing (a) chemical, (b) mechanical, and (c) electrical characterizations of the polymer blend. Scan sizes 5x5 μm. Image Credit: Bruker Nano Surfaces and Metrology
AFM‑IR Provides Valuable Nanoscale Information for Polymers
AFM‑IR is a robust, non‑invasive method able to identify chemical compositions and their distributions on the nanoscale. This localized characterization offers important information about the macroproperties and functions of polymeric materials.
Data obtained from AFM‑IR measurements are essential for enhancing current polymer fabrication processes and for developing novel functional polymers. When integrated with other AFM modes, AFM‑IR also facilitates correlative research of the chemical, mechanical, thermal, and electrical characteristics of polymers.
Acknowledgments
Produced from materials originally authored by Qichi Hu, Ph.D. (Sr Staff Applications Scientist), Chunzeng Li, Ph.D. (Sr Engineer Development), Cassandra Phillips, Ph.D. (Sr Product Manager Nanoscale), Peter De Wolf, Ph.D. (Sr Director of Technology and Application).
References and Further Reading
- Dazzi, A., et al. (2005). Local infrared microspectroscopy with subwavelength spatial resolution with an atomic force microscope tip used as a photothermal sensor. Optics Letters, 30(18), p.2388. https://doi.org/10.1364/ol.30.002388.
- Hamadeh, A., et al. (2023). Toward conformational identification of molecules in 2D and 3D self-assemblies on surfaces. Communications Chemistry, (online) 6(1). https://doi.org/10.1038/s42004-023-01036-8.
- Hikaru Yabuta, Cody, G.D., et al. (2023). Macromolecular organic matter in samples of the asteroid (162173) Ryugu. Science, 379(6634). https://doi.org/10.1126/science.abn9057.
- Li, Y., et al. (2024). Identification and quantification of nanoplastics (20–1000 nm) in a drinking water treatment plant using AFM-IR and Pyr-GC/MS. Journal of hazardous materials, 463, pp.132933–132933. https://doi.org/10.1016/j.jhazmat.2023.132933.
- Tang, F., Bao, P. and Su, Z. (2016). Analysis of Nanodomain Composition in High-Impact Polypropylene by Atomic Force Microscopy-Infrared. Analytical Chemistry, 88(9), pp.4926–4930. https://doi.org/10.1021/acs.analchem.6b00798.
- Büttler, J.R., Bechtold, T. and Pham, T. (2020). Investigation of Interfacial Diffusion in PA/PP-g-MAH Laminates Using Nanoscale Infrared Spectroscopy. Langmuir, 36(33), pp.9886–9893. https://doi.org/10.1021/acs.langmuir.0c01447.
- Ural, M.S., et al. (2022). Quantification of drug loading in polymeric nanoparticles using AFM-IR technique: a novel method to map and evaluate drug distribution in drug nanocarriers. The Analyst, (online) 147(23), pp.5564–5578. https://doi.org/10.1039/d2an01079h.
- Brütting, C., et al. (2023). Sustainable Immiscible Polylactic Acid (PLA) and Poly(3-hydroxybutyrate-co-3-hydroxyvalerate) (PHBV) Blends: Crystallization and Foaming Behavior. ACS Sustainable Chemistry & Engineering, 11(17), pp.6676–6687. https://doi.org/10.1021/acssuschemeng.3c00199.
- Guo, M., et al. (2021). Toroidal polar topology in strained ferroelectric polymer. Science, 371(6533), pp.1050–1056. https://doi.org/10.1126/science.abc4727.
- Zhao, S., et al. (2024). Investigation of the influence of aluminum surficial water on aluminum-plastic hybrids through a combined experimental and simulation approach. Applied Surface Science, 656, pp.159694–159694. https://doi.org/10.1016/j.apsusc.2024.159694.

This information has been sourced, reviewed and adapted from materials provided by Bruker Nano Surfaces and Metrology.
For more information on this source, please visit Bruker Nano Surfaces and Metrology.