The distinct chemical structure of 6PPD (N-(1,3-dimethylbutyl)-N'-phenyl-p-phenylenediamine) leads to its use as an anti-degradant (antioxidant) additive in a wide range of rubber products (Figure 1).

Image Credit: Andrii Sedykh/Shutterstock.com
It plays a key role in the prevention of tire degradation and the extension of their lifespan. However, 6PPD suffers from a notable drawback as it forms a highly toxic substance, 6PPD-quinone (6PPD-Q), when it reacts with ozone in the atmosphere.
Microscopic particles are released from automotive tires into the environment as they wear. These tire road wear particles (TRWP) contain many chemical substances, including 6PPD-Q. These particles accumulate in the environment as microplastics as they are washed into rivers and other bodies of water on rainy days.
The negative impact of these microplastics on ecosystems and the environment represents a major issue, with 6PPD-Q shown to induce acute mortality in Salmonidae fish, particularly coho salmon.1
There is currently no commercial alternative able to adequately maintain tire stability and performance while ensuring minimal environmental impact.
Accurate assessment of 6PPD levels in rubber products must underpin research into alternatives, coupled with objective determination of whether alternative compounds offer equivalent performance and stability while minimizing environmental impact.
This article outlines the measurement of 6PPD levels in tire rubber using a pyrolysis gas chromatograph mass-spectrometer (Py-GC-MS) system.
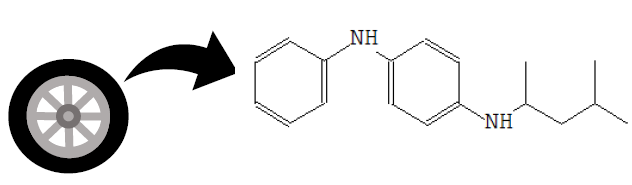
Fig 1. Chemical Structure of 6PPD. Image Credit: Shimadzu Scientific Instruments
Analysis Process
ISO/TS 21396 outlines a Py-GC-MS-based method for determining the mass concentration of TRWP in soil and sediment.2
In this study, Py-GC-MS was used for the analysis in line with this method. However, the study leveraged optimized analytical conditions.
Figure 2 shows a schematic diagram of the analysis process, while Table 1 features analysis conditions for the employed thermal desorption (TD)-GC/MS method. The thermal desorption temperature was selected based on results obtained via the EGA-MS method.
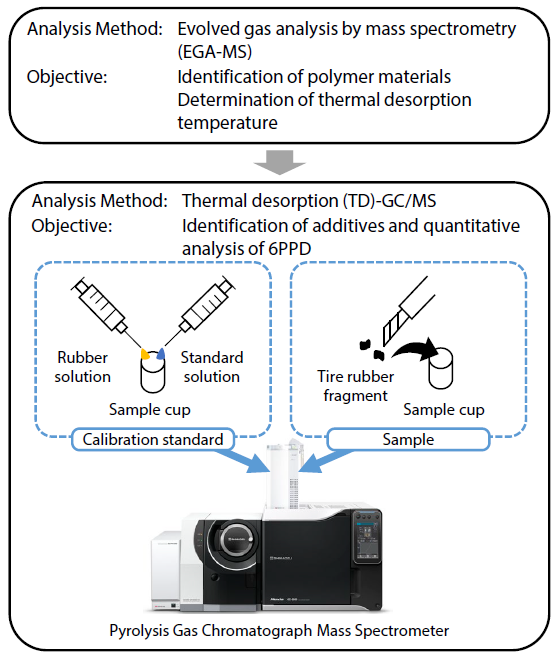
Fig 2. Analysis Process. Image Credit: Shimadzu Scientific Instruments
Table 1. TD-GC/MS Analysis Conditions. Source: Shimadzu Scientific Instruments
| Instruments |
Pyrolyzer Unit:
GC-MS: |
EGA/PY-3030D Multi-Shot Pyrolyzer
AS-1020E Auto-Shot Sampler
(Frontier Laboratories Ltd.)
GCMS-QP2020 NX |
| TD-GC-MS |
| Pyrolyzer Analysis Mode: |
Double-Short Analysis |
| Thermal Desorption Temp.: |
60–20 °C/min-370 °C (1 min) |
| ITF Temp.: |
300 °C (Auto) |
| Gas Chromatograph Column: |
SH-5Sil MS (30 m × 0.25 mm I.D., df = 0.25 μm) *1 |
| Oven Temp.: |
40 °C (0 min)→25 °C/min→250 °C (0 min)→15 °C/min→310 °C (20 min) |
| Sample Injection Unit: |
300 °C |
| Carrier Gas: |
He |
| Control Mode: |
Constant linear velocity (40 cm/s) |
| Injection Method: |
Split |
| Split Ratio: |
15 |
| Mass Spectrometer ITF Temp.: |
320 °C |
| Ion Source Temp.: |
200 °C |
| Ionization Method: |
EI |
| Measurement Mode: |
Scan (m/z 44-500) |
| Event Time: |
0.3 sec |
*1 P/N: 221-76127-30
Sample Preparation
A standard solution of the target compound (6PPD) and a resin solution were combined to prepare calibration standards. A solution of the rubber used in the sample, styrene-butadiene rubber (SBR), was used as the calibration standard to ensure that both the sample and the calibration standards had identical rates of thermal desorption.
To prepare the 6PPD standard solution, 6PPD was diluted in toluene. Calibration standards with prescribed amounts of 6PPD were prepared by adding 1 µL of 6PPD standard solution to a sample cup along with 20 µL of the resin solution. The mixture was dried at room temperature before being analyzed via TD-GC/MS (Figure 3).
A fragment of tire rubber was used as a sample, and a knife was used to cut off approximately 0.5 mg of tire rubber before adding glass wool to prevent the sample from falling. This sample was analyzed via TD-GC/MS.
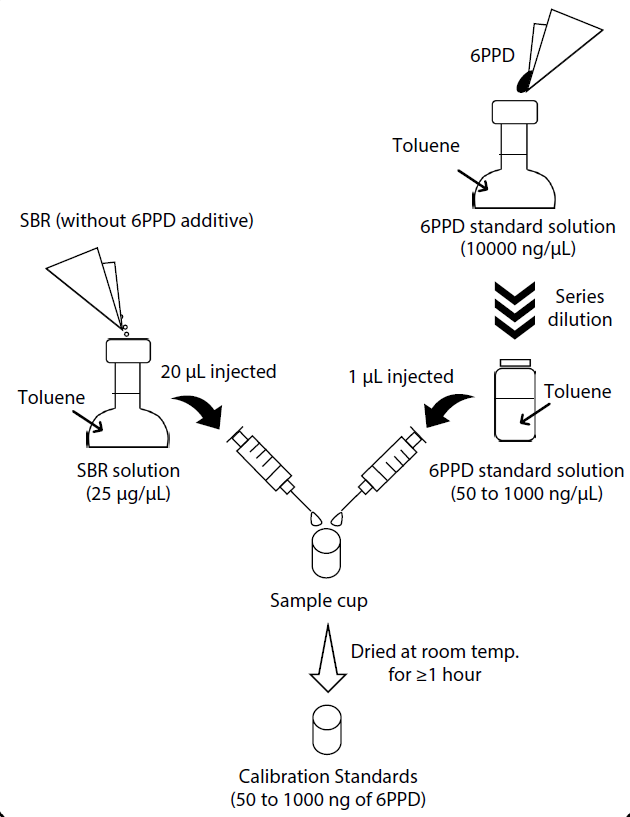
Fig 3. Preparation of Calibration Standards. Image Credit: Shimadzu Scientific Instruments
Qualitative Additive Analysis
Figure 4 shows the total ion current (TIC) chromatogram acquired by analyzing the tire rubber. It was also possible to perform a spectral library search using NIST-23 and Shimadzu’s Polymer Additives Library.
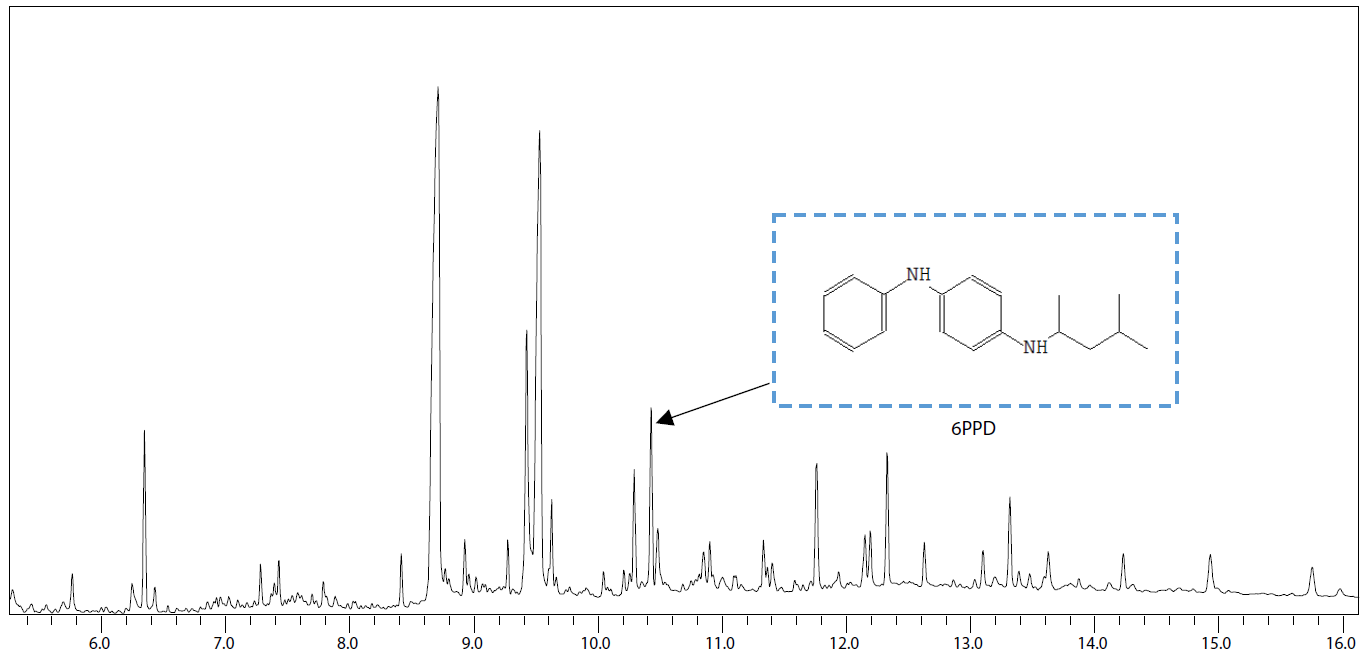
Fig 4. TIC Chromatogram of Tire Rubber Fragment. Image Credit: Shimadzu Scientific Instruments
Figure 5 shows the library search results for the peak eluted at around 10.43 minutes. The peak was inferred to be the anti-degradant Nocrac 6C (a trade name for the chemical 6PPD), based on results from Shimadzu’s Polymer Additives Library.
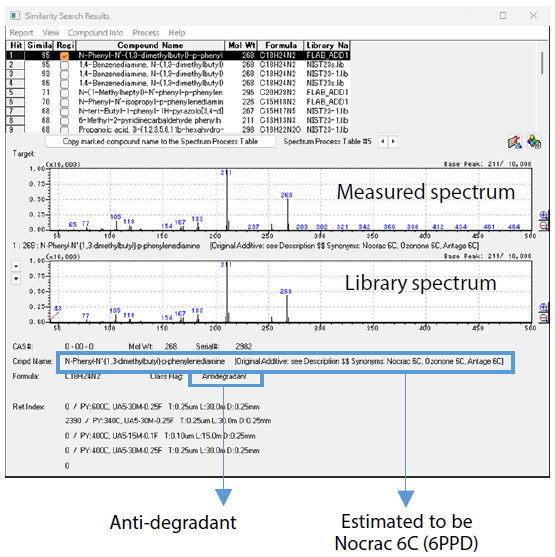
Fig 5. Qualitative Analysis with Polymer Additives Library. Image Credit: Shimadzu Scientific Instruments
Quantifier Ion Investigation
Figure 6 features the TIC and mass chromatogram for the 1000 ng 6PPD calibration standard. The ions at m/z 211 and 268 were chosen as the quantifier and reference ions, respectively. These ions were selected based on the absence of interference from resin components and their high signal intensity.
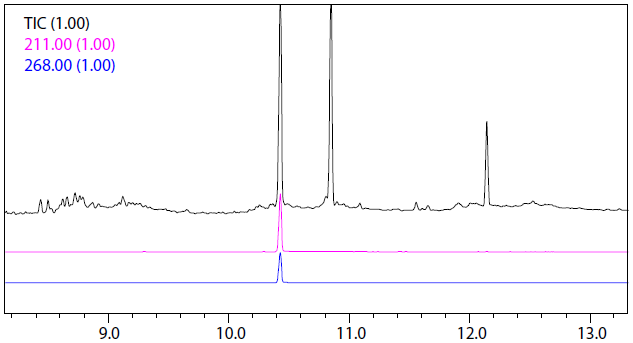
Fig 6. TIC and Mass Chromatogram of Calibration Standard (1000 ng). Image Credit: Shimadzu Scientific Instruments
Calibration Curve
Calibration standards of 0, 50, 250, 500, and 1000 ng of 6PPD were analyzed to prepare a calibration curve for the external standard method. The calibration curve’s linearity was assessed as good, with an R2 above 0.999 (Figure 7).
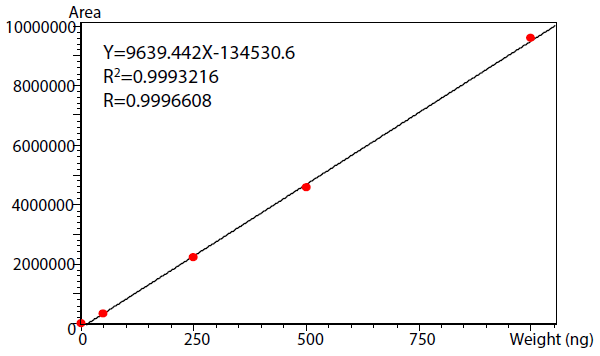
Fig 7. 6PPD Calibration Curve. Image Credit: Shimadzu Scientific Instruments
Confirming Repeatability, Limit of Quantification, and Limit of Detection
The 50 ng 6PPD calibration standard was analyzed seven times in succession to assess repeatability using %RSD.
Table 2 shows the methods used to calculate the limit of quantitation (LOQ) and limit of detection (LOD). The method’s repeatability was determined to be good, with a %RSD below 5%. It was also shown that the method was sensitive enough for practical use, with an LOD of 3.0 ng.
LOQ and LOD Calculation Methods. Source: Shimadzu Scientific Instruments
| |
|
LOQ = 10 σ/slope
LOD = 3 σ/slope |
slope: calibration curve slope
σ: standard deviation at 50 ng |
Table 2. Repeatability, LOQ, and LOD. Source: Shimadzu Scientific Instruments
| %RSD at 50 ng |
LOQ (ng) |
LOD (ng) |
| 3.3 |
10.2 |
3.0 |
Sample Analysis
Table 3 shows the amount of 6PPD measured in tire rubber. The analysis revealed that the tire rubber contained 1200 mg/kg of 6PPD.
Table 3. Quantitative Results for 6PPD. Source: Shimadzu Scientific Instruments
| Sample Analyzed (mg) |
6PPD Weight (ng) |
6PPD Conc. (mg/kg) |
| 0.53 |
620 |
1200 |
Conclusion
The examples presented here demonstrate an analysis of 6PPD in tire rubber via Py-GC-MS. It was observed that good results were acquired in terms of calibration standard repeatability, calibration curve linearity, limit of quantification, and limit of detection.
Shimadzu’s Polymer Additives Library was also key to identifying the additive.
References and Further Reading
- Tian, Z., et al. (2021). A ubiquitous tire rubber–derived chemical induces acute mortality in coho salmon. Science, 371(6525), pp.185–189. DOI: 10.1126/science.abd6951. https://www.science.org/doi/full/10.1126/science.abd6951.
- ISO. ISO/TS 21396:2017 Rubber - Determination of mass concentration of tire and road wear particles (TRWP) in soil and sediments - Pyrolysis-GC/MS method. Available at: https://www.iso.org/obp/ui/#iso:std:iso:ts:21396:ed-1:v1:en.
- Shimadzu Corporation. (2025). Analysis of Base Material and Additives in Tire Rubber - Pyrolysis-GC-MS/FPD Detector Splitting - Application News No. 01-00901. Available at: https://www.shimadzu.com/an/apl/25426/index.html.
- Shimadzu Corporation. Analysis of 6-PPD-Quinone in River Water and Local Stream Matrix using LCMS-8060 Triple Quadrupole Mass Spectrometer Application News No. SSI-LCMS-133. Available at: https://www.ssi.shimadzu.com/sites/ssi.shimadzu.com/files/pim/pim_document_file/ssi/applications/application_note/22580/SSI-LCMS-133.pdf.
- Kudo, Y., et al. (2021). Detailed Analysis of an Unknown Polymer Using the Py-GC/MS System with Polymer Additives and F-Search Polymer Libraries Technical Report. Available at: https://www.shimadzu.com/an/sites/shimadzu.com.an/files/pim/pim_document_file/technical/technical_reports/10562/jpo219043.pdf.
Acknowledgments
Produced from materials originally authored by Ayaka Miyamoto and Yoshihiro Aoyama from Shimadzu Scientific Instruments Incorporated.

This information has been sourced, reviewed, and adapted from materials provided by Shimadzu Scientific Instruments.
For more information on this source, please visit Shimadzu Scientific Instruments.