Microplastics (MPs) are classed as plastic particles between 1 µm and 5 mm in size (according to ECHA 2019). These tiny pieces of plastic have become a major environmental concern as they find their way into various ecosystems, being detected in bodies of water, including oceans, rivers, and lakes, as well as the air we breathe.
The persistent presence of MPs in the environment, particularly of small (<100 µm) microplastics known as SMPs, poses a considerable threat to biota and human health. However, with a serious lack of conventional methods for sampling, pretreatment, and analysis, research into MPs and SMPs remains inconsistent and challenging.
This leads to unstable data quality and reliability across studies, making results difficult to compare. To gain conclusive insights, access to accurate chemical identification and quantification of MPs and SMPs is vitally important for evaluating their true environmental impact and developing strategies to limit their presence.
Moreover, pretreatment procedures such as extraction and purification are crucial when analyzing these contaminants across various environmental matrices. Good, reliable pretreatment ensures analytes are successfully separated from other substances and interferences, facilitating precision identification and quantification while reducing the risk of degrading or denaturing these polymers.
To ensure consistency and reliability in the method and results, cross-validation of different analytical methods for analyzing MPs, particularly SMPs, is critical owing to a lack of standardized guidelines.
In this study, SMPs of various size ranges and different polymer typologies were analyzed by leveraging two support typologies (BaF2 support and an Anodisc filter) with micro FTIR-NIR spectroscopy. In addition, a real environmental sample was used for comparison: a wet deposition from the urban area of Mestre, Venice, Italy.
This real sample was filtered on an Anodisc support after being subjected to an established oleo extraction and purification procedure,1 which demonstrated the utility and accuracy of the applied methodologies.
This comparison offers a practical benchmark for confirming the analytical approach, ensuring that the results are representative of real-world environmental conditions. Anodisc filters are not composed of polymer materials, and they cost less than other filters, but they can be limiting as they are only transparent in the mid-IR region between 4000 and 1210 cm-1.
However, they are completely transparent in the NIR region because aluminum oxide does not demonstrate any significant peaks in this region.
FT-NIR Spectroscopy
FT-NIR spectroscopy, or Fourier transform near-infrared spectroscopy, is a technique used to obtain and evaluate the near-infrared absorption spectrum of a material sample. FTIR works by detecting the frequencies and intensity of near-infrared light absorbed by a sample, generally within the 780 to 2500 nanometers wavelength range.
As near-infrared light is directed at a sample, certain wavelengths interact with and are absorbed by the chemical bonds in microplastics, generating a distinctive spectrum that acts as the material’s fingerprint and provides information about its molecular composition and structure.
An FT-NIR microscope allows researchers to analyze extremely small samples and can also be used to evaluate microplastics, along with FTIR and Raman microscopies.
Once acquired, the spectrum of a particle is compared with spectra in reference libraries to determine which plastic polymers are present in environmental samples. FT-NIR spectroscopy can be used to analyze microplastics on Anodisc filters because the material in these filters does not absorb in this spectral region.
References: Polymer Preparation
Three commercially available reference polymers, sourced from Goodfellow GmbH, Hamburg, Germany, were purchased. These included polyamide 6 (PA6), maximum size 55 µm; low-density polyethylene (LDPE), maximum size 300 µm; and polyethylene terephthalate (PET), maximum size 300 µm.
All references were of known size and polymer type and were used to generate new spectral libraries. Two supports were employed for the identification of the reference polymers and evaluation of potential polymer spectra interferences:
- A barium fluoride (BaF2) plate, since it does not absorb through the NIR range, enables streamlined spectral acquisition without interference from the support material.
- Anodisc filters: Aluminum oxide filters, 0.2 µm, 47 mm Anopore Inorganic Membrane, Whatman, purchased from Merck (Darmstadt, Germany)
These filters are commonly used for the analysis of MPs and SMPs.1 Anodisc filters are designed to simulate environmental conditions more closely, offering researchers a more realistic context for the real-world environmental samples analysis.
Wet Deposition Sampling, Sample Pretreatment, and Filtration
Wet deposition samples were obtained using an automated wet-dry collector (Wet&Dry Sampler FAS005AB, 152 MTX, Padova, Italy). The sampling collector was placed on the roof of the scientific campus of Ca’ Foscari University of Venice in Mestre, Italy, and equipped with two stainless steel vessels.
In each vessel, the researchers inserted two decontaminated glass jars along with a rain sensor that could adjust the cover position over the two vessels. This assembly allows for the collection of wet or dry depositions, respectively, depending on the precipitation, hence the name.
After sampling, wet depositions were placed into a decontaminated glass flask along with ultrapure water and ethanol and stored at 4 °C. The samples were then pretreated and filtered through Anodisc filters, followed by application of an optimized method developed by Corami et al., 2020.
The entire procedure was then documented and written up - from sampling to pretreatment and filtration - detailing the methodology, quality assurance, and quality control (QA/QC) procedures, and has since been submitted to a scientific journal for peer review (Rosso et al., 2024).
Analysis
Both the reference polymers and the samples were analyzed using Thermo Scientific™ Nicolet™ RaptIR™+ FTIR Microscope, equipped with OMNIC™ Paradigm Software. This microscope delivers a series of benefits when running advanced infrared microscopy applications. The Thermo Scientific Nicolet RaptIR X FTIR Microscope, the latest addition to the Nicolet RaptIR FTIR microscopy platform, is now available. The RaptIR X microscope builds on the infrared microscopy capabilities demonstrated in this study and provides a current solution for FTIR microscopy and chemical imaging applications.
RaptIR is a non-destructive instrument that offers exceptional spatial resolution, chemical imaging capabilities, versatility, enhanced sensitivity, and advanced data analysis capabilities, making it a powerful instrument for a diverse range of scientific and industrial applications.
It is compatible with an array of detector types, including MCT detectors cooled with or without liquid nitrogen and InGaAs detectors. The instrument's dynamic capabilities support versatility and enhanced performance across IR and NIR microscopy applications.
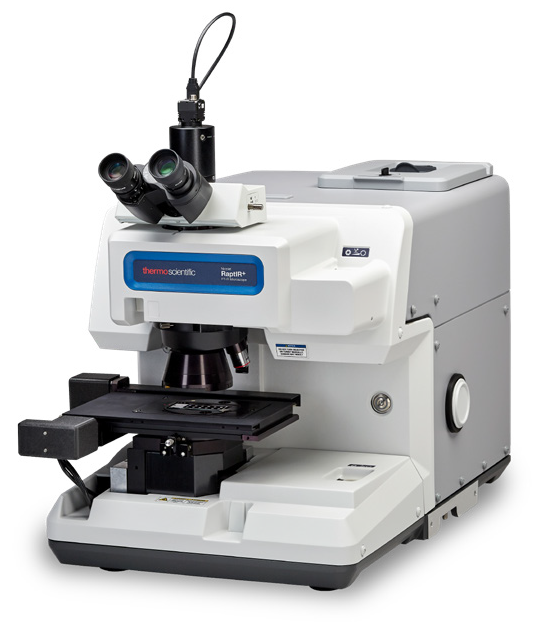
Figure 1. Thermo Scientific Nicolet RaptIR+ FTIR Microscope. Image Credit: Thermo Fisher Scientific - Vibrational Spectroscopy
Methodology
The analysis began by capturing a visual mosaic using the RaptIR microscope’s 4x objective lens, offering a comprehensive overview of the sample area. Subsequently, a more detailed visual and infrared (IR) mosaic was acquired using the 15x objective lens, enabling close examination and enhanced detection of microplastic particles.
Together, these imaging techniques provided comprehensive coverage and enhanced analysis, enabling precision identification and characterization of the microplastics within the sample.
The spectral resolution captured was 8 cm-1 with a one-second acquisition time for each spectrum, and transmittance modes were also employed. Surface particle selection was determined using the OMNIC Paradigm software, where spectra and size were retrieved.
Results
Reference Materials and NIR Libraries
The 4x and 15x objective lenses were used to capture the visual mosaics from each support, with the FT-NIR spectra subsequently acquired for each analyzed particle. The mosaic images offered a good combination of high-resolution visuals of particles analyzed (Figures 2a and b).
The next step involved retrieving the spectra from each reference polymer analyzed with FT-NIR Spectroscopy using BaF2 and Anodisc support, respectively (Figures 3 and 4). BaF2 was used because it is completely transparent in the NIR and mid-IR regions.
The purpose was to show that when using Anodisc filters, the spectra remain intact. This cannot be said, however, for the mid-IR region; the total absorption of Anodisc filters is under 1210 cm-1.
The results determined that both supports offered strong FT-NIR spectra for the three MP polymer typologies, with no major differences in the clarity or accuracy of the spectral data acquired from each substrate.
Therefore, it was verified that Anodisc filters were deemed suitable for MPs analysis in FT-NIR spectroscopy. This paves the way to expand the range of analytical techniques for MPs and SMPs detection without compromising data quality or analytical reliability. Anodisc filters are the preferred choice over silicon, gold-coated, or silver-coated filters, in large part due to Anodisc’s substantially lower cost.
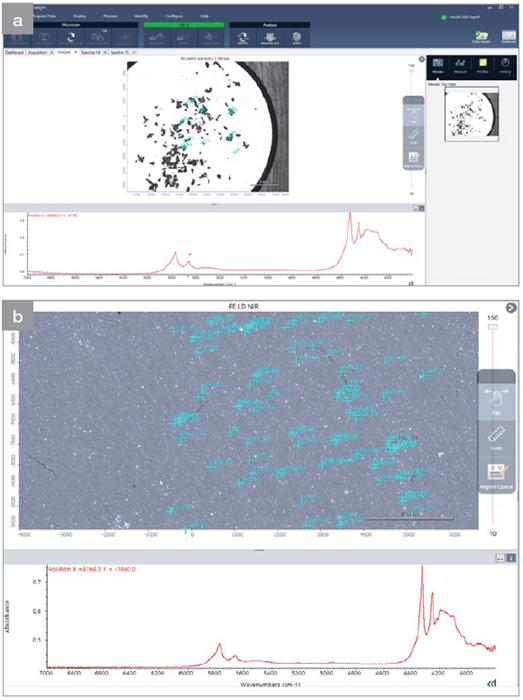
Figure 2. Visual mosaics with respective NIR spectra of an LDPE MP, obtained from (a) BaF2 support and (b) ANODISC support. Image Credit: Thermo Fisher Scientific - Vibrational Spectroscopy
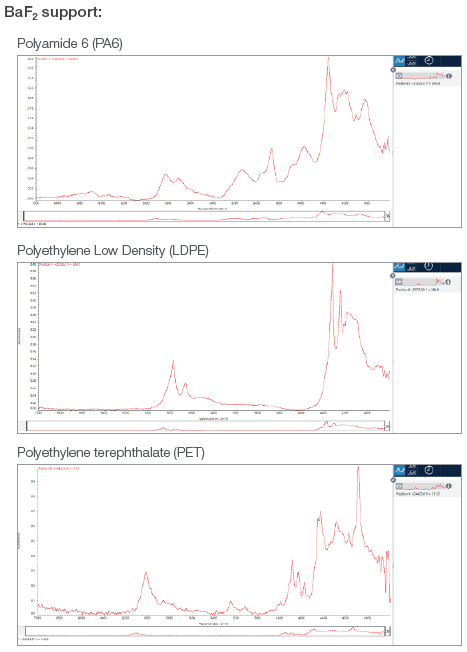
Figure 3. NIR spectra obtained from each polymer typology with BaF2 support, used to create the library. Image Credit: Thermo Fisher Scientific - Vibrational Spectroscopy
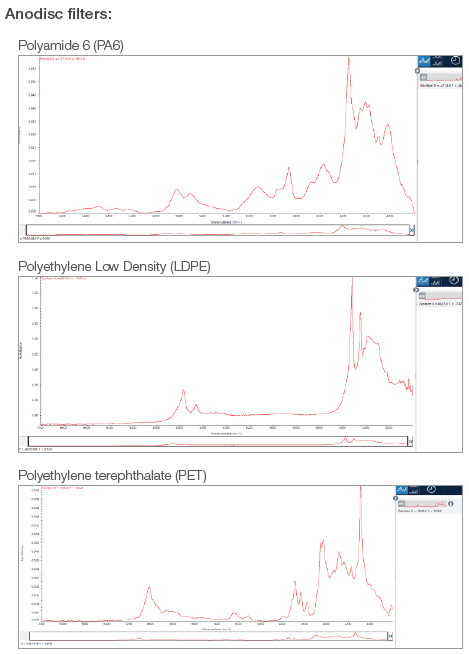
Figure 4. NIR spectra libraries obtained from each polymer typology with Anodisc support. Image Credit: Thermo Fisher Scientific - Vibrational Spectroscopy
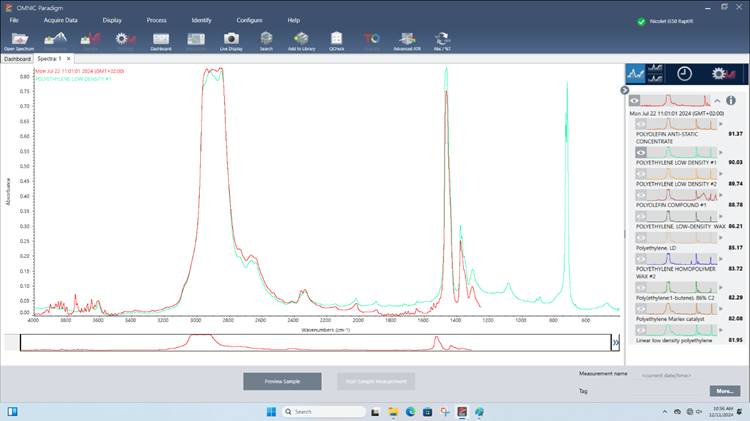
Figure 5. LDPE microplastic on Anodisc filter in mid-IR region. It’s possible to identify the MP, but the spectral region is limited. Image Credit: Thermo Fisher Scientific - Vibrational Spectroscopy
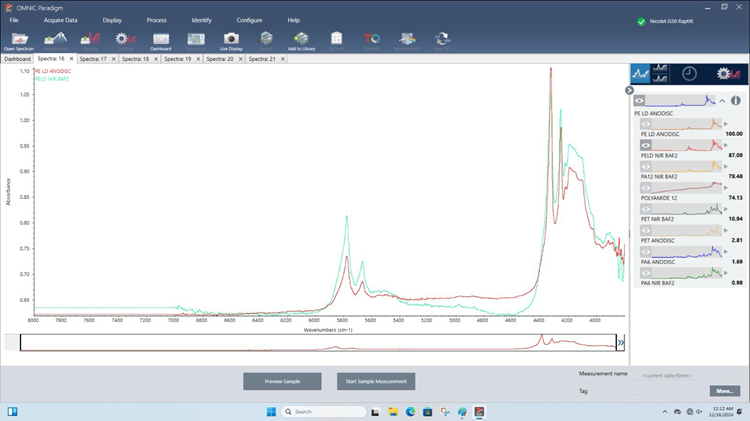
Figure 6. LDPE microplastic on Anodisc filter in NIR region. The spectral range is the same as the spectrum in the library. Image Credit: Thermo Fisher Scientific - Vibrational Spectroscopy
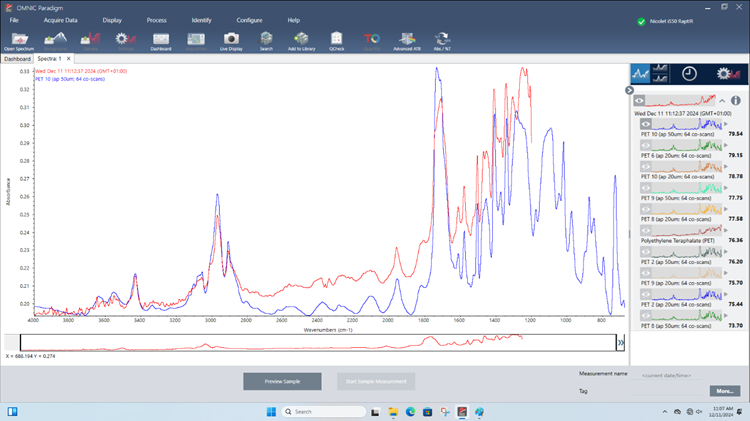
Figure 7. PET microplastic on Anodisc filter in mid-IR region. It is possible to identify the MP, but the spectral region is limited. Image Credit: Thermo Fisher Scientific - Vibrational Spectroscopy
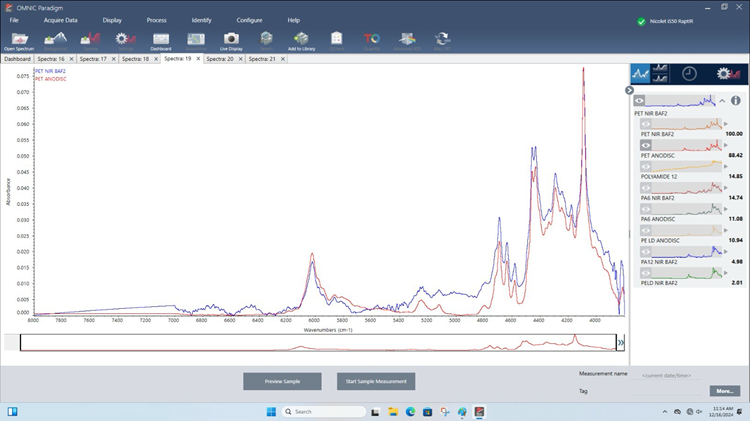
Figure 8. PET microplastic on Anodisc filter in NIR region. The spectral range is the same as the spectrum in the library. Image Credit: Thermo Fisher Scientific - Vibrational Spectroscopy
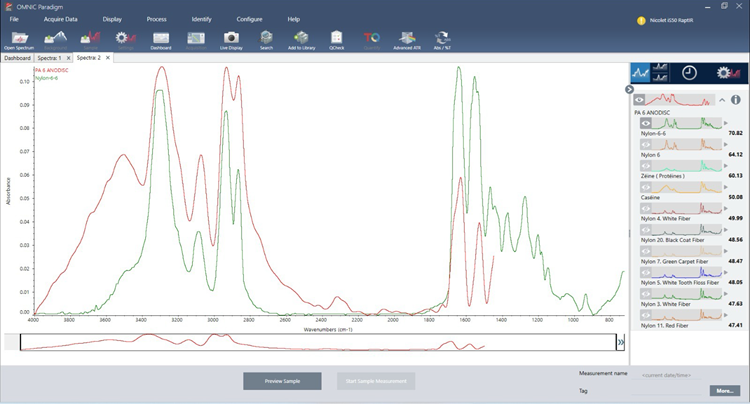
Figure 9. Polyamide 6 microplastic on Anodisc filter in mid-IR region. It is possible to identify the MP, but the spectral region is limited. Image Credit: Thermo Fisher Scientific - Vibrational Spectroscopy
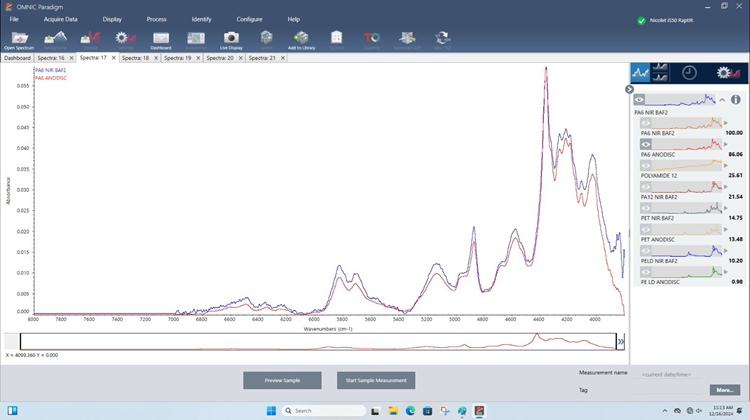
Figure 10. Polyamide 6 microplastic on Anodisc filter in NIR region. The spectral range is the same as the spectrum in the library. Image Credit: Thermo Fisher Scientific - Vibrational Spectroscopy
MPs in Wet Deposition Samples
Wet deposition samples were analyzed using the FTI-NIR technique, which corresponded to that of the reference polymers. Visual mosaics were acquired (Figure 11a), and particle selection was performed using the software (Figure 11b).
The particles were then subjected to analysis, and the spectra were taken from each particle, each of which was compared to the established NIR libraries. Using the initial results as a baseline, SMPs of LDPE were identified successfully with a match >85%, and their average length was 250 µm.
For example, a plastic particle exhibiting a length of 249 µm in length (Figure 11b) was defectively detected with a match at 93% agreement (Figure 11c). This verifies the compatibility of the Anodisc filters and their reliability for SMPs analysis in real environmental samples using FTIR-NIR spectroscopy.
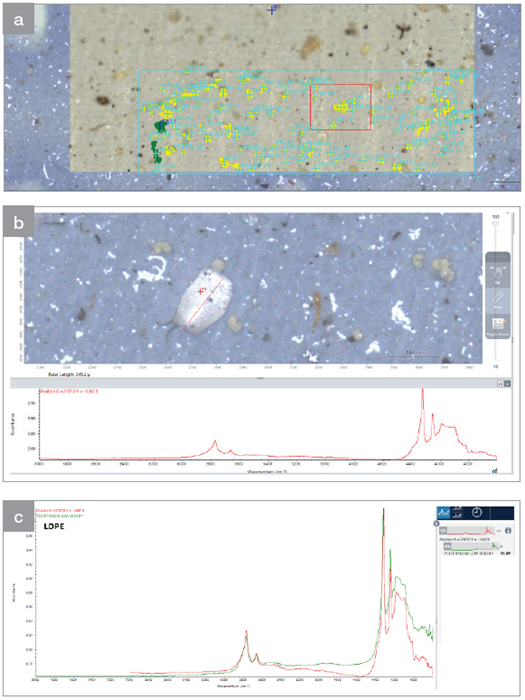
Figure 11. A visual mosaic obtained from wet deposition samples analyzed (a) on Anodisc filters; (b) a visual of an unknown sample and its spectrum; (c) library spectra of LDPE. Image Credit: Thermo Fisher Scientific - Vibrational Spectroscopy
Conclusion
The results of the study revealed that FT-NIR spectroscopy can be considered a viable technique for analyzing SMPs in environmental matrices, delivering rapid analysis times and showing its potential for real-time monitoring.
FT-NIR spectroscopy has the capacity to analyze a diverse range of polymers of varying densities, as well as sample matrices when a suitable pretreatment methodology is followed.
Because FT-NIR is non-destructive, it also supports further analysis in the optics of SMPs’ cross-validation methodology approach. This makes results both consistent and reliable in contrast to the lack of standardized MP procedures to date. To expand the overall SMPs library using this method, further studies are required.
Anodisc filters were deemed the most suitable support for this analysis, demonstrating the effectiveness of the applied methodologies for evaluating SMPs in real environmental samples. Future research should expand the scope of environmental matrices to evaluate SMPs in different environmental conditions.
Acknowledgments
Produced using materials originally authored by Beatrice Rosso and Fabiana Corami from the Institute of Polar Sciences, and Barbara Bravo from Thermo Fisher Scientific.
References and Further Reading
- Corami, F., et al. (2021). Small microplastics (< 100 μm), plasticizers and additives in seawater and sediments: Oleo-extraction, purification, quantification, and polymer characterization using Micro-FTIR. Science of The Total Environment, 797, p.148937. DOI:10.1016/j.scitotenv.2021.148937. https://linkinghub.elsevier.com/retrieve/pii/S0048969721040092.
- “Quantification and chemical identification of small microplastics (SMPs <100 µm) in wet and dry deposition from an urban area”, submitted to Environmental Pollution, under review (10/2024).

This information has been sourced, reviewed. and adapted from materials provided by Thermo Fisher Scientific - Vibrational Spectroscopy.
For more information on this source, please visit Thermo Fisher Scientific - Vibrational Spectroscopy.