Microplastics’ universal presence in air, aquatic sources, and food chains has made them a growing global concern. As a result, regulatory agencies are increasingly monitoring environmental pollution to establish the scope and methodology for microplastic characterization.
This important work is key to addressing concerns around this widespread environmental pollutant. The diversity and size of these microcontaminants present challenges to such method development, particularly around establishing this work and ensuring its efficiency.
Fourier-transform infrared spectroscopy (FTIR) is a widely used analytical tool for polymer identification. FTIR is well-suited for the simple, straightforward detection of large numbers of microplastic particles.
The Nicolet™ RaptIR™ FTIR Microscope from Thermo Scientific™ offers powerful automation features that enable rapid extraction of microparticle data. This article summarizes its microplastic analysis workflow.
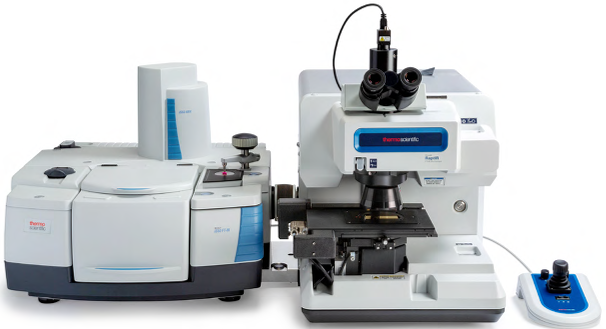
Nicolet RaptIR FTIR Microscope with the Thermo Scientific™ Nicolet™ iS50 FTIR Spectrometer. Image Credit: Thermo Fisher Scientific - Vibrational Spectroscopy
Methodology
The Particle Analysis feature in Thermo Scientific™ OMNIC™ Paradigm Desktop Software makes it easy to evaluate microplastics on appropriate filters such as gold-coated polycarbonate, silicon, or aluminum oxide (Al2O3) on stainless steel.
Image analysis of the filter surface initially locates particles based on their visual contrast. The software will then use stored particle locations to relocate the sampling stage and collect a spectrum for each particle. These spectra are then analyzed against the most relevant spectral libraries.
The Nicolet RaptIR FTIR Microscope can collect hundreds or even thousands of particle spectra without the need for user supervision, making this workflow especially efficient. Collection time is also minimized because only particle spectra are collected, and the filter is bypassed.
A report is created following this analysis, with results for each particle presented, including size and identification.
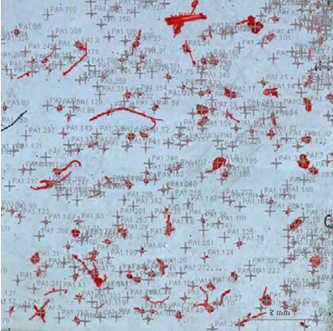
Figure 1. Silicon filter with atmospheric deposition of microplastics. Particles were selected in the size range of 25 μm to 1.5 mm. Image Credit: Thermo Fisher Scientific - Vibrational Spectroscopy
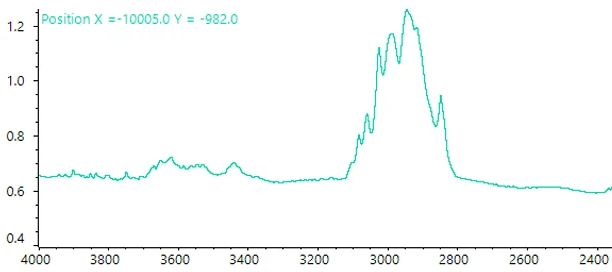
Figure 2. A single scan of a representative particle. Image Credit: Thermo Fisher Scientific - Vibrational Spectroscopy
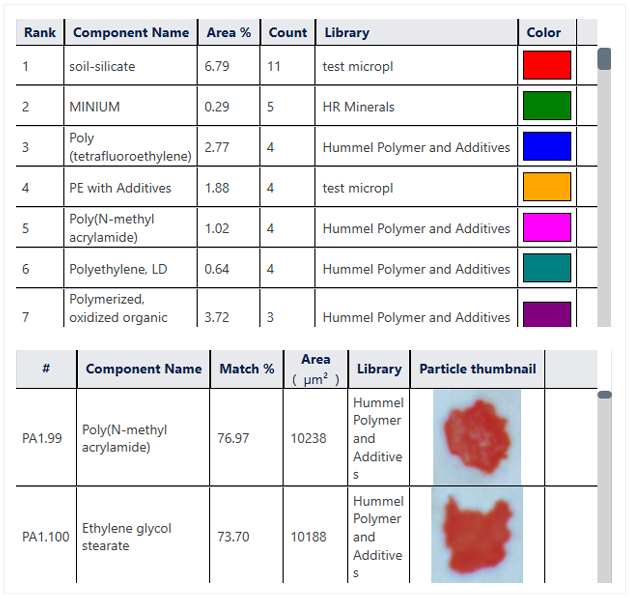
Figure 3. Typical particle analysis report. Image Credit: Thermo Fisher Scientific - Vibrational Spectroscopy
Efficient Particle Analysis
The OMNIC Paradigm Software drives the Nicolet RaptIR FTIR Microscope. The Particle Analysis tool facilitates microplastics analysis in just three simple steps.
- Select the target analysis region before defining the particle size range (Figure 1).
- Acquire spectra from the selected set of particles with a single click (generally, 16 scans at 8 cm-1).
- Request a particle analysis report. This report matches each particle to library spectra of known polymer materials and size characteristics, calculates match percentages, and presents them in the report.
Comprehensive Results in Report Format
Figure 3 shows an example of a particle analysis report, featuring a complete sample analysis picture that includes a listing of each particle’s size, identification, and image. It is also possible to customize the report to highlight specific particle histograms and size-distribution measurements for each particle material.
Summary
Rapid, automated particle analysis with FTIR microscopy is now both achievable and easy to perform.
The Nicolet RaptIR FTIR Microscope can analyze hundreds of microplastics in minutes, depending on the scan count, resolution, and number of particles analyzed. The IR microscope offers a wide range of tools and offers excellent flexibility, making it ideally suited to fast, accurate microplastics analysis.

This information has been sourced, reviewed, and adapted from materials provided by Thermo Fisher Scientific - Vibrational Spectroscopy.
For more information on this source, please visit Thermo Fisher Scientific - Vibrational Spectroscopy.