Multilayer polymer laminate packaging materials are carefully engineered composites, with each polymer layer selected to deliver specific chemical and physical properties. This design allows for the customization of features such as flexibility, mechanical strength, and resistance to environmental factors like light, moisture, and gases. The thickness of these layers can vary widely, from less than a micron to over 100 microns.
In quality assurance and failure analysis, it is vital to confirm the identity of the various layers, as well as their thickness. This also enables the reverse engineering of unknown multilayer polymer materials. Both Raman spectroscopy and Fourier transform infrared (FTIR) can be used to identify and distinguish across a vast range of different polymeric materials. When these techniques are used in combination with a microscope, they uniquely complement the analysis of individual layers in such multilayer materials.
FTIR and Raman microspectroscopy are generally seen to be complementary techniques. They are both vibrational spectroscopy techniques that provide information about molecular structure and chemical identity. There are, however, some key differences. FTIR tends to be better at emphasizing the different functional groups found in polymers, such as esters, amides, and hydroxyl constituents, because its selectivity is based on dipole moments.
Often, a greater number of FTIR libraries tend to be available, which is an advantage when trying to identify unknown materials.
Based on polarizability, Raman selectivity often emphasizes polymer backbones and delocalized bonding, such as aromatic structures. This method provides easier access to lower-wavenumber parts of the vibrational spectrum, making it easier to observe molecules with heavier atoms, such as inorganic pigments. Visible Raman spectroscopy uses visible lasers, enabling improved spatial resolution compared to FTIR microspectroscopy. Though the two techniques have some disadvantages, they are highly effective at analyzing individual layers in multilayered polymer packaging materials.
This article compares the results gained when analyzing a cross-section of a multilayer polymer laminate using both FTIR and Raman microspectroscopy techniques. FTIR transmission analysis required the use of a thin cross-section. While this was not necessary for the Raman analysis, the same cross-section was used in both analyses to avoid any variations that could occur because of different sample preparation methods being used.
Experimental
The polymer film was sandwiched between two rigid layers of polytetrafluoroethylene (PTFE) to prepare the cross-section of the multilayer laminate. This assembly was clamped in a holder, and thin cross-sections were acquired using a Thermo Scientific™ Shandon Finesse™ E+ Microtome. Cross-sections of the multilayer polymer film were easily separated from the PTFE and positioned flat on a barium fluoride window for analysis. A Thermo Scientific™ Nicolet™ RaptIR™ FTIR Microscope was used in transmission mode to conduct the FTIR microscopy analysis, and the Raman analysis was performed using the Thermo Scientific™ DXR3xi Raman Imaging Microscope.
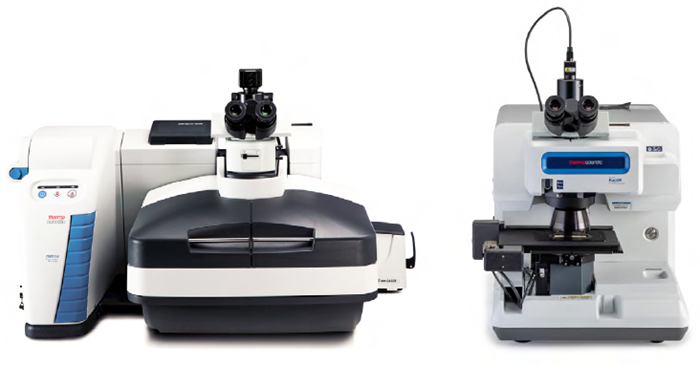
DXR3xi Raman Imaging Microscope and Nicolet RaptIR FTIR Microscope. Image Credit: Thermo Fisher Scientific - Vibrational Spectroscopy
FTIR Analysis Results
The Nicolet RaptIR FTIR Microscope makes it easy to find the sample on the window by quickly collecting a high-quality visual mosaic of the entire window using a four-times visual objective, before automatically switching to the 15-times infrared objective.
The initial mosaic gives a visual guide, allowing the user to locate samples and areas of interest. More detailed visual mosaics and infrared analysis can be gathered using the 15 times objective. Figure 1 details this workflow, showing the large, four-times visual mosaic alongside the higher-magnification visual mosaic. The defined area shown in Figure 1 shows the analyzed portion of the cross-section. The aperture was 5 microns, perpendicular to the polymer layers, and spectra were collected across the cross-section at 2-micron steps.
An FTIR image based on a multivariate curve resolution (MCR) analysis can be seen in Figure 2. This form of analysis compares each spectrum to all the other spectra in the image and groups similar spectra together as components. The different components are allocated a color to generate the image. In this case, there are six different layers and five different components (red, yellow, green, light blue, and blue). A key advantage of MCR analysis is that no previous knowledge of specific spectral features is necessary.
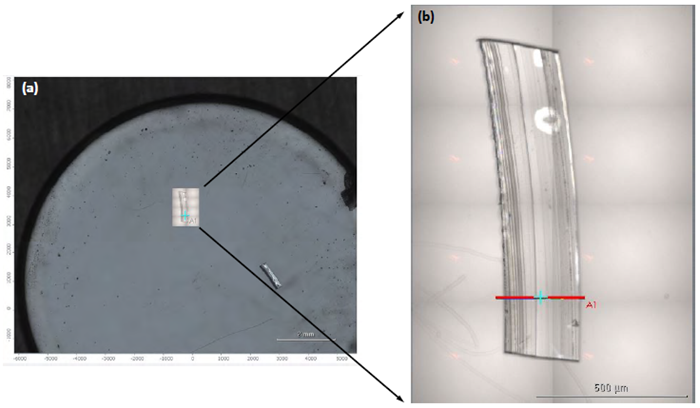
Figure 1. (a) Initial visual mosaic image collected with a 4X visual objective showing essentially the entire barium fluoride window. This view is used to locate the cross-section on the window. (b) Second visual mosaic of the cross-section collected with the 15X infrared objective. Area A1 indicates the portion of the cross-section that was analyzed. Image Credit: Thermo Fisher Scientific - Vibrational Spectroscopy
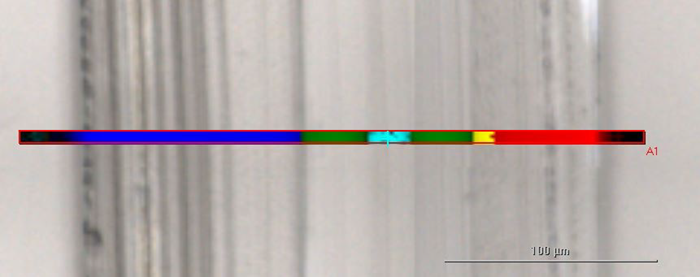
Figure 2. MCR FTIR image of the cross-section of the multilayer polymer film. Each color represents a different polymer material; there are five different polymer materials and six layers. Image Credit: Thermo Fisher Scientific - Vibrational Spectroscopy
These results can serve as a starting point for exploring other profile choices that could better define the different layers. The FTIR images shown in Figure 3 are based on correlation profiles using the spectra shown as references. The spectra can be searched and compared against libraries to help identify the different layers. Layer 5 was identified as poly(propylene-ethylene) by comparing its spectrum with those of layers 1 and 6.
The thicknesses of the various layers were measured using the provided ruler tool in the software. It was possible to identify the various layers in this multi-layer polymer film and determine the thickness of each individual layer.
Raman Analysis Results
A DXR3xi Raman Imaging Microscope was used to analyze the same laminate sample. Figure 4 shows the visual mosaic image acquired with a 50× objective on the Raman microscope. The defined area represents the portion of the cross-section analyzed. The Raman spectra generated an MCR image that was very similar to the image produced following the FTIR analysis, with five components and six layers.
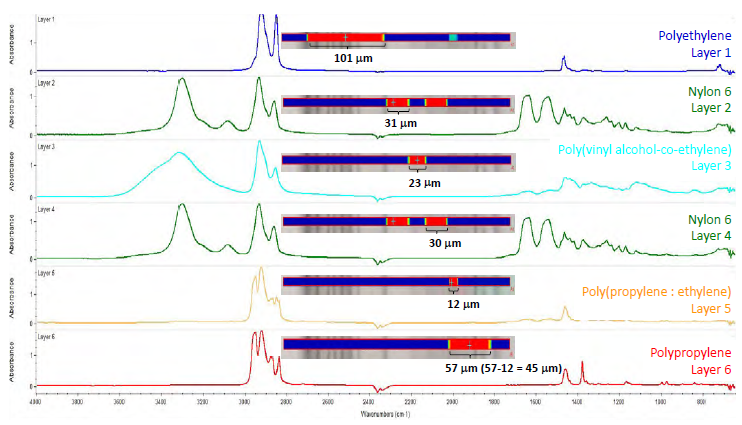
Figure 3. Representative FTIR spectra from each of the polymer layers, along with associated correlation FTIR images that show the locations of the different types of polymeric materials. The materials were identified by spectral searching against commercial libraries, and the thicknesses of the layers were determined using the ruler option in the software. Image Credit: Thermo Fisher Scientific - Vibrational Spectroscopy
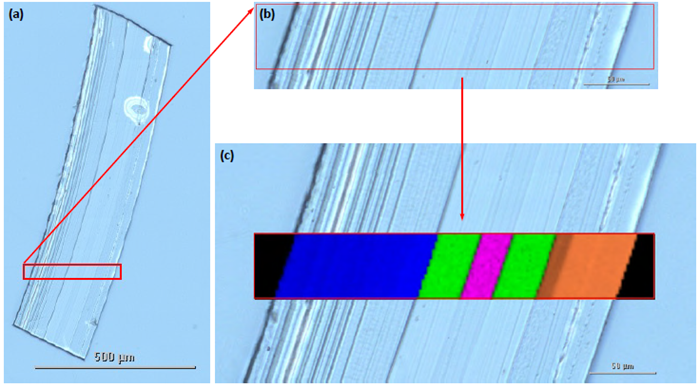
Figure 4. (a) Visible mosaic of the cross-section collected using a 50X objective on the Raman microscope. (b) Area on the cross-section selected for Raman analysis. (c) MCR Raman image showing five different polymer materials and six layers. Image Credit: Thermo Fisher Scientific - Vibrational Spectroscopy
Correlation profiles were used to define each layer of the sample. Figure 5 shows the results of those profiles. The various layers in the laminate could be identified by searching against Raman spectral libraries, but the Raman spectra lacked the strong spectral features associated with polar functional groups, which were readily apparent in the FTIR spectra.
The N-H peaks in the nylon spectra are visible, but their appearance is much weaker in the Raman spectra than in the FTIR spectra. The O-H peak is not apparent in the Raman spectra, making identification even more difficult with the poly(vinyl alcohol-ethylene) layer.
It was still possible to obtain a library match for this spectrum, but it was less definitive than the FTIR spectrum. Conversely, the identification of polyethylene in the poly(propylene-ethylene) layer was more readily apparent in the Raman spectra. This is due to the presence of the 1295 cm-1 peak that is associated with polyethylene, which does not overlap with any polypropylene peaks.
In the FTIR spectra, the polyethylene and polypropylene peaks overlap significantly, so the differences are more subtle in these spectra.
The layer thicknesses were measured using the ruler tool in the Raman microscope’s software; the values were highly consistent with those determined from the FTIR analysis. While Raman analysis provided higher resolution, this did not substantially impact the determination of the layer thicknesses.
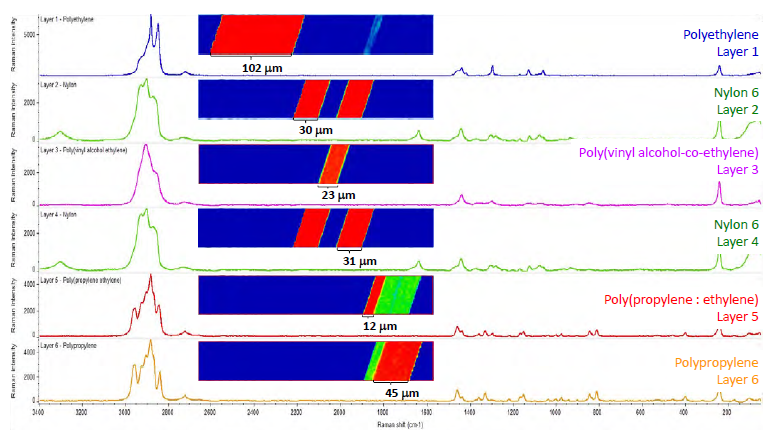
Figure 5. Representative Raman spectra from each of the six layers and the corresponding Raman correlation images showing the location of each type of polymer material. The polymer layers were identified by spectral searching against commercial libraries, and the thicknesses of the layers were determined using the ruler tool in the software. Image Credit: Thermo Fisher Scientific - Vibrational Spectroscopy
Conclusions
Raman microspectroscopy and FTIR provided comparable results when analyzing a multilayer polymer film. The collection times for the two data sets were similar. The image pixel size for the Raman imaging and the step size for the FTIR mapping were both two microns, and it is evident that any differences in spatial resolution were not a factor in the sample analysis.
While the FTIR spectra had a slightly improved signal-to-noise ratio, both the FTIR and Raman spectra were of high quality and allowed for both layer identification and layer thickness determinations. The differences in the selection rules for Raman and FTIR caused differences in the peak intensities associated with molecular functionalities. This means that the two techniques highlight unique aspects of the various polymers in the laminate.
For example, the poly(vinyl alcohol-ethylene) layer was more readily identified in the FTIR data, whereas the small amount of polyethylene present in the poly(propyleneethylene) layer was more readily seen in the Raman data. The same cross-section was used for both, even though Raman analysis is not a transmission technique, so it was unnecessary to prepare a thin section for the microscope. This means sample preparation for Raman analysis can be less complex, saving time and effort.
There are other aspects to consider, including fluorescence, resolution of ultra-thin layers, and the analysis of pigments, which might persuade a user to choose one or the other. It is evident that both the DXR3xi Raman Imaging Microscope and the Nicolet RaptIR FTIR Microscope are excellent choices for analyzing multilayer laminates.

This information has been sourced, reviewed, and adapted from materials provided by Thermo Fisher Scientific - Vibrational Spectroscopy.
For more information on this source, please visit Thermo Fisher Scientific - Vibrational Spectroscopy.