In health, environmental, and food-related research, microplastics (<5 mm) and nanoplastics (<1 µm) are of increasing concern. Particle-resolved data on morphology, chemical composition, and size is necessary to accurately identify them.
Raman microscopy is a non-destructive measurement method with submicron spatial resolution, providing imaging of nano- and microplastics and comprehensive chemical characterization.
Raman spectroscopy produces molecular fingerprints that enable clear material categorization, founded on inelastic light scattering. This article contrasts two correlative Raman-based techniques for nanoplastics investigation: Raman imaging and particle-by-particle microspectroscopy.
Comparing Measurement Methods
Particles are chosen optically and characterized individually in particle-by-particle microspectroscopy. This flexible technique is suited to targeted characterization but is limited by a longer measurement time with more particle counts, reduced statistical relevance, and selection bias.
Spatially resolved chemical datasets are produced when using Raman imaging. This enhances the reliability of categorization using spectral imaging, facilitates heterogeneous particle analysis, and supports chemical contrast-based identification.
Experimental Setup
In this experiment, the confocal RAMANtouch Raman microscope, coupled with a high-numerical-aperture objective, was used to perform all measurements. Specifications were optimized to balance spectral quality, acquisition speed, and spatial resolution, as strict measurement optimization is critical for trustworthy nanoplastic analysis.
- Laser wavelength: 532 nm
- Laser power: 8.7 mW (point mode)/115 mW (line mode)
- Integration time: Two x 0.5 seconds (point mode)/three seconds (line mode)
- Objective: 100×, NA 0.9
- Step size (imaging): 200 nm
- Identification technique: Library matching (particle mode)/correlation (imaging)
Results and Discussion
The reference sample of nanoplastic particles was measured on a flat glass surface to minimize the effect of the filter substrate on contrast. Both particle-by-particle and imaging methods were deployed to assess performance in sensing, locating, and measuring particles.
Particle-by-Particle Microspectroscopy
In the first stage, nanoplastic particles were localized in relation to their visual contrast in the optical image. Primary settings such as size filters, autofocus conditions, and intensity thresholds were adjusted to optimize particle detection.
These parameters require precise tuning as they strongly determine the final particle metrics. Prior to the experiment, integration time and laser power were selected.
Once the procedure had started, the extracted particle coordinates were examined successively. For every particle identified (Figure 1, top right), a Raman spectrum was collected and matched to its respective morphological features from the visual image.
In the final stage, material identification was performed by searching the database for matches to the obtained spectra, thereby concluding the automated analysis process from particle localization to chemical classification. The located particles were accurately determined to be polystyrene.
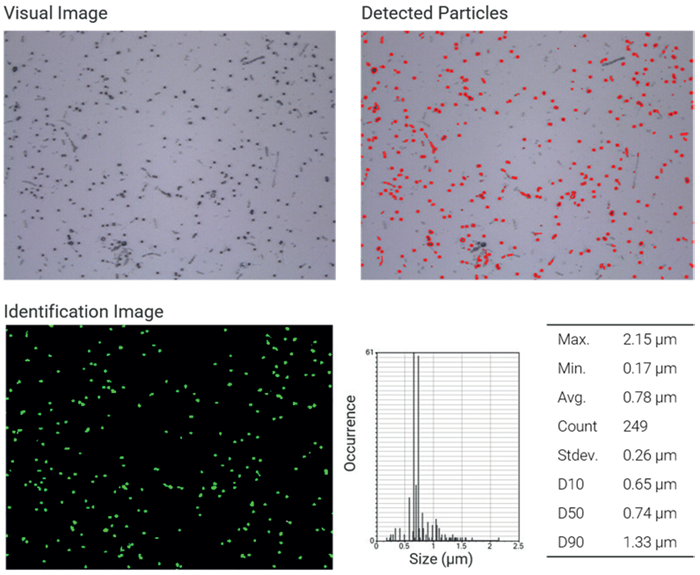
Figure 1. NP analysis particle by particle. Top left: Visual image of nanoplastics (100x objective lens). Top right: Map of detected particles based on visual contrast. Bottom left: Identified polystyrene particles based on the Raman spectrum. Bottom right: Particle and size statistics. Image Credit: Bruker Optics
Raman Imaging
The same field of view was analyzed for Raman imaging utilizing laser line scanning. The integration time and laser power in this method required optimization to strike a balance between high acquisition speed and adequate signal-to-noise ratio, together with the scanning step size.
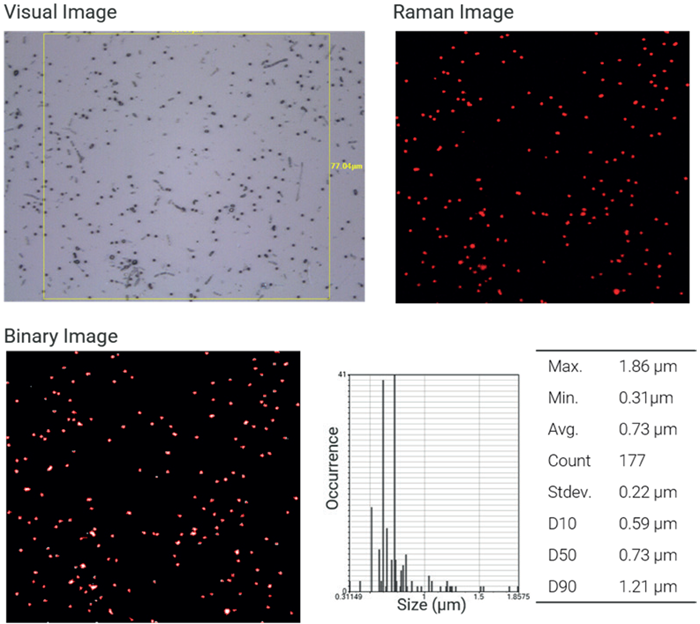
Figure 2. NP analysis by imaging. Top left: Image of nanoplastics with the region of interest (100x objective lens). Top right: Raman image of polystyrene particles based on correlation analysis. Bottom left: Binarization of the Raman image to extract particle statistics. Bottom right: Particle and size statistics. Image Credit: Bruker Optics
The subsequent Raman dataset (Figure 2) was examined with correlation evaluation, where reference spectra of various polymer classes were used. Red is used to portray a high correlation with the polystyrene reference spectrum, validating the material composition that was expected.
The correlation image was binarized to derive the resulting particle metrics (Figure 2, bottom right). It is important to note that the measurement’s spatial resolution highly influences these metrics, especially the chosen step size, which directly affects the precision of particle shape and size calculation, along with the thresholds for binarization.
Direct Comparison
In sum, both techniques delivered accurate identification and detection of nanoplastics as low as submicron sizes. After rejecting particles outside the Raman imaging area, proportionate particle counts were gathered for each technique.
Small variations were noted:
- In Raman imaging, two of the particles observed are not detected in the particle-by-particle method (Figure 3, white circles), and inversely (Figure 3, blue circles).
- Due to the inclusion of neighboring characteristics, particle sizes acquired using optical detection tend to be bigger (Figure 3, orange circles).
- Pixel resolution and step size strongly impact Raman imaging-based sizing.
These variations occur due to intrinsically different assessment and detection techniques. Optical pre-selection is essential for particle-by-particle investigation, which can leave out low-contrast particles, while Raman imaging offers a transparent chemical map of the whole area of measurement.
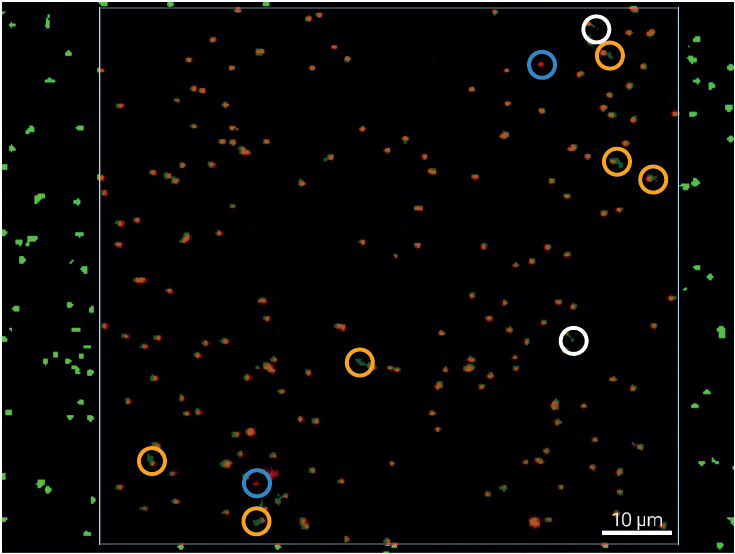
Figure 3. Particle Analysis Overlay. Merge of particle-by-particle and Raman imaging analysis results. White circles indicate particles detected by microspectroscopy but absent from the Raman imaging result, while light blue circles highlight particles identified by Raman imaging but not captured by the particle-by-particle approach. Yellow circles mark discrepancies in particle size, arising from differences among the respective size-determination methods. Image Credit: Bruker Optics
Conclusion
Raman microscopy is a robust and flexible technique for nanoplastics determination, providing chemical classification and particle-resolved evaluation at the submicron level.
Both Raman imaging and particle-by-particle microspectroscopy deliver effective performance and provide highly similar results in a controlled model system.
While particle-by-particle analysis delivers speedy and targeted quantification, Raman imaging provides objective, spatially resolved chemical data. The high correlation between these techniques underscores their reciprocal nature.
These methods, when used together, make for an adaptable and strong analytical procedure for nanoplastics characterization and form a solid base for additional analysis of real-world samples and complex mixtures.
Acknowledgments
Produced from materials originally authored by Fabian Knechtel from Bruker Optics GmbH & Co. KG.

This information has been sourced, reviewed, and adapted from materials provided by Bruker Optics.
For more information on this source, please visit Bruker Optics.