Carbon nanotubes have unique structure with excellent electrical and mechanical properties. As they show promise for future innovations, great efforts are put in to characterizing these nanostructures. This article presents the results of the analysis of carbon nanotubes using the WITec CRM200 that features both Atomic Force Microscopy (AFM) and Confocal Raman Microscopy in a single instrument.
Carbon Nanotube Analysis with WITec CRM200
Analysis of Carbon Nanotubes on Silicon
The WITec CRM200 captured an image of carbon nanotubes using the Raman Spectral Imaging Mode, which acquires a complete Raman spectrum at every image pixel. The image was produced by calculating the intensity of all Raman spectra. It is possible to display the spectrum at each pixel subsequent to the measurement.
Figure 1 displays a 100 x 100µm area (200 x 200 pixels) that includes 40,000 spectra using an acquisition time of 100ms per spectrum and laser power of 100mW at 532nm. In this sample, the deposition of the nanotubes was onto a specially treated silicon substrate, which allowed the nanotubes to assemble in rows.
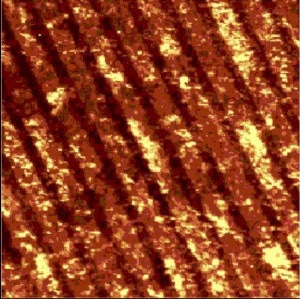
Figure 1. Image of the integral intensity of all Raman lines: Carbon nanotubes assembled in rows with corresponding Raman spectra.
The regular and easily observable arrangement is shown with the corresponding spectra as represented by the arrows. Figure 2 illustrates the spectrum of carbon nanotubes with two characteristic Raman lines at 1600/cm and 2690/cm. Figure 3 shows the spectrum of silica with the two characteristic Raman lines at 520/cm and 950/cm.
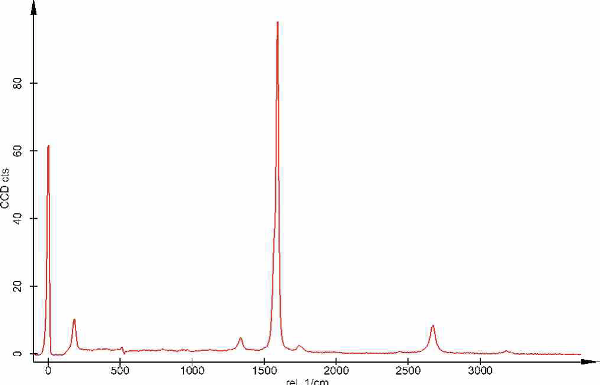
Figure 2. Spectrum of carbon nanotubes.
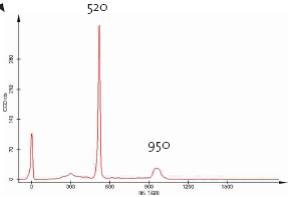
Figure 3. Spectrum of Silica.
It is possible to perform AFM measurements on the same sample without making contact by simply rotating the objective turret of the microscope. Figure 4 delineates an overview of the sample at a scan range of 20µm x 20µm and 256 x 256 pixels. The image was acquired at 1.5s/line.
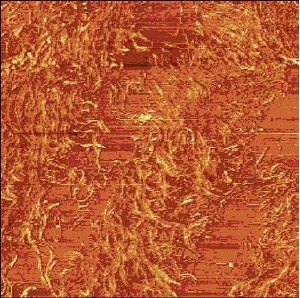
Figure 4. AFM measurement at a scan range of 20µm x 20µm.
The images shown in Figures 5 and 6 are zoom-ins of 5µm x 5µm and 1.5µm x 1.5µm, respectively. The size of a single tube varies between 15nm and 60nm.
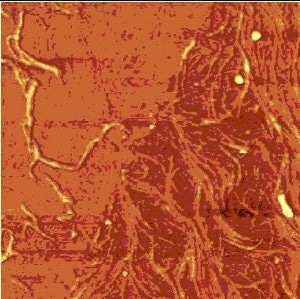
Figure 5. Zoom-in, 5µm x 5µm.
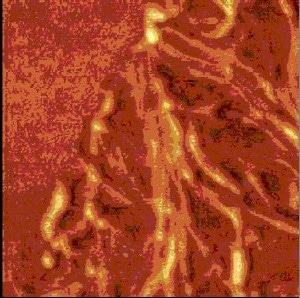
Figure 6. Zoom-in, 1,5µm x 1,5µm.
Imaging of Laser Vaporization Grown Single-Wall Carbon Nanotubes (SWNTs)
This analysis involved the imaging of SWNTs grown by laser vaporization at the Oak Ridge National Laboratory. A spin-coating technique was used to deposit the SWNTs on a silicon substrate. Figure 7 illustrates an AFM measurement at a scan range of 14µm x 14µm and 256 x 256 pixels.
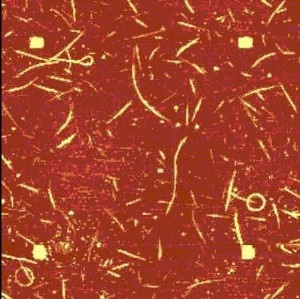
Figure 7. AFM measurement at a scan range of 14µm x 14µm.
Figure 8 depicts the corresponding measurement on the same sample position using the Spectral Imaging Mode of the CRM200, yielding a complete spectrum at every pixel. The scan range was 14µm x 14µm with 150 x 150 pixels (equal to 22500 spectra) and an integration time of 50ms.
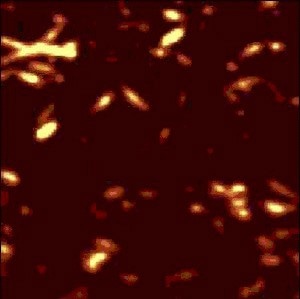
Figure 8. Raman measurement, on the same sample position, at a scan range of 14µm x 14µm.
The image was constructed by combining all Raman lines. Using both images, the spectral data can be clearly connected to dedicated nanotubes seen in the AFM image. Measuring the intensity of the Raman spectrum based on the polarization determines the orientation of the tubes. The polarization of the laser light along the nanotube axis always results in the strongest signal. Hence, two measurements were taken, one initial measurement, and the second one was by rotating the sample by 90° (Figures 9 and 10).
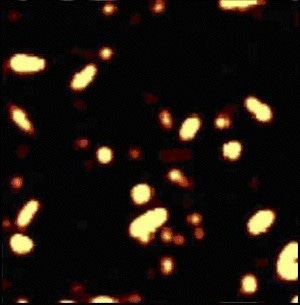
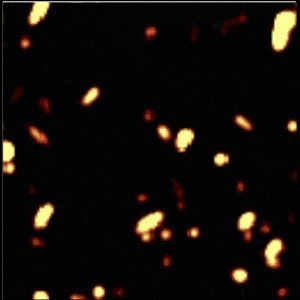
Figure 9+10. Different carbon nanotubes are visible, depending on the polarization of light. Polarization plain in Fig. 10 (bottom) is rotated by 90°.
Different carbon nanotubes are made visible based on the polarization of the incident light. Figure 11 delineates a detailed evaluation of the acquired spectral data of one carbon nanotube, showing different Raman lines.
Each part of the spectrum, the G-band at around 1580/cm, the D-band at around 1330/cm, the radial breathing mode (RBM) at around 180/cm, the G'- band, and the second-order-modes can be utilized to distinguish properties of carbon nanotubes.
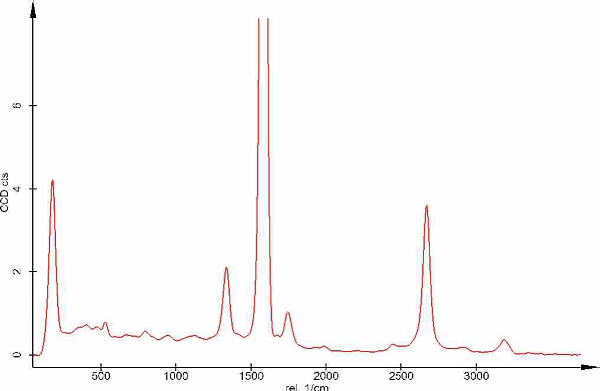
Figure 11. Spectrum of carbon nanotubes.
Conclusion
The aforementioned results clearly demonstrate the ability of the WITec CRM200 to provide in-depth characterization of carbon nanotubes.

This information has been sourced, reviewed and adapted from materials provided by WITec GmbH.
For more information on this source, please visit WITec GmbH.