By integrating a Raman spectrometer within a state-of-the-art confocal microscope setup, Raman imaging with a spatial resolution down to 200 nm laterally and 500 nm vertically can be achieved using visible light excitation. Only light from the image focal plane can reach the detector, which strongly increases image contrast and slightly increases resolution. Special filters are used to suppress the reflected laser light while enabling the Raman scattered light to be detected with a spectrometer/CCD camera combination.
With this setup, a complete Raman spectrum is acquired at each image pixel, typically taking between 0.7 and 100 ms. The individual spectra are combined to form Raman images consisting of tens of thousands of spectra. From this multispectrum file, an image is generated by integrating over a certain Raman line in all spectra or by evaluating the various peak properties such as peak-width, min/max analysis or peak position.
Due to the confocal arrangement, even depth profiling and 3-D imaging are possible if the sample is transparent. Using such a sensitive setup can also be an advantage when performing measurements on delicate and precious samples requiring the lowest possible levels of excitation power. Time resolved investigations of fast dynamic processes can also benefit from the ultrafast spectral acquisition times.
Oil Alkane Water Emulsion
In the following study, the ultrafast Confocal Raman Imaging capabilities of the alpha300 R were used to analyze an oil-alkane-water emulsion three dimensionally. In a volume of 30 x 30 x 11.5 µm, 23 confocal Raman scans were acquired in z-direction leading to 23 Raman images each consisting of 150 x 150 pixel (22 500 spectra). The total acquisition time for one image was 60 s resulting in 23 min for the acquisition of the complete stack (517 000 Raman spectra). Fig. 1 a shows one of the 23 color coded x-y Raman images from the stack (green: oil, red: alkane, blue: water), the corresponding spectra (de-mixed) are shown in Fig. 1 b. Using a 3D reconstruction software, a three dimensional image of the distribution of the three compounds can be created as shown in Fig 1 c (green: oil, red: alkane, blue: water).
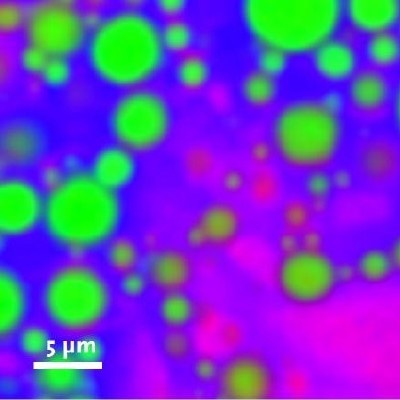
Figure 1 a: One of the 23 color coded x-y Raman images from a 3D imaging-stack of an oil-alkane-water emulsion (Green: Oil, Red: Alkane, Blue: Water, 30 x 30 µm, 150 x 150 pixel, 22 500 spectra).
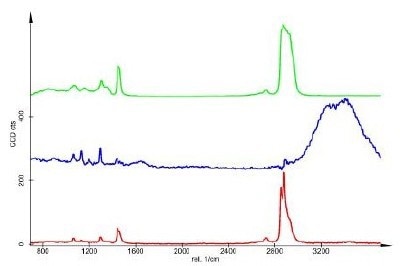
Figure 1 b: Corresponding spectra (de-mixed, Green: Oil, Red: Alkane, Blue: Water).
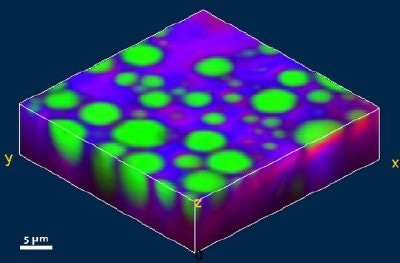
Figure 1 c: Three dimensional reconstruction image of the distribution of the oil, alkane and water (Green: Oil, Red: Alkane, Blue: Water, 30 x 30 x 11.5 µm, 150 x 150 x 23 pixel, 517 500 Raman spectra, total acquisition time of the stack: 23 min).
Micro-Diamond Inclusion in Quartz
In the following study a micro-diamond inclusion in quartz was investigated with the alpha300 R in order to capture the 3D shape of the micro-diamond and to detect impurities. Fig. 2a shows a bright field video image of the diamond inclusion (bottom illumination, top view).
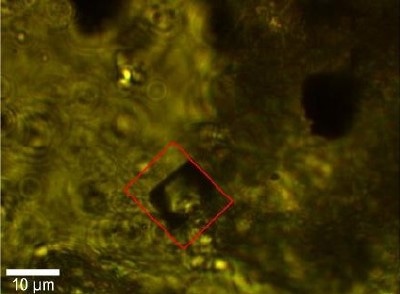
Figure 2 a: Video image of the diamond inclusion indicating the scan range for the Raman image.
For 3 D Raman imaging the scan range was 13x16x15 µm consisting of 100x120x12 pixels, resulting in 144,000 Raman spectra. A 100x (NA 0.9) objective was used with an excitation wavelength of 532 nm (600g/mm grating, 50 µm pinhole).
Fig. 2b displays the resulting 3D Raman image of the complete micro-diamond inclusion. The diamond is shown in red whereas the quartz matrix was not considered in the evaluation process and is not shown. Inside the diamond inclusion one can identify various regions with impurities shown in turquoise (size range: submicron to few microns). The corresponding Raman spectra are shown in Fig. 2 c (same color coding) clearly revealing the peak of the contamination near 730 1/cm.
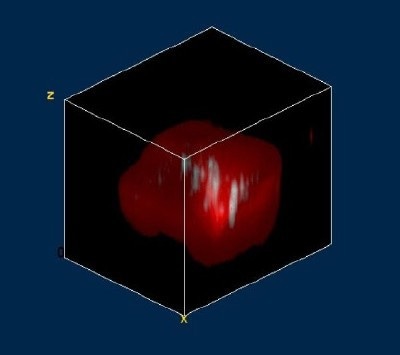
Figure 2 b: Three dimensional reconstruction image of the diamond inclusion in quartz (Red: Diamond; Turquoise: Impurities; 13 x 16 x 15 µm, 100x100x12 pixel, 144,000 Raman spectra).
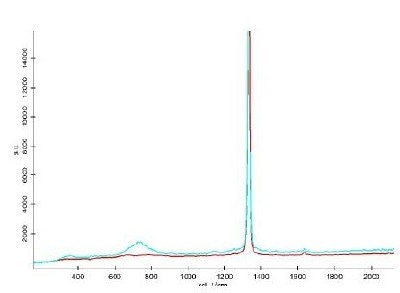
Figure 2 c: Corresponding spectra (Red: Diamond, Turquoise: Contaminations).

This information has been sourced, reviewed and adapted from materials provided by WITec GmbH.
For more information on this source, please visit WITec GmbH.