The Zetasizer Nano range accurately and reproducibly determines the size of particles or molecules, yielding results with the optimum level of confidence possible.
The Zetasizer NanoSampler delivers the same performance even if there is an increase in the sample throughput. Calibration is not required for the Zetasizer Nano as it employs light scattering to obtain results from first principles.
The GLP performance verification process typically employs polystyrene (PS) latex standards of known size. This article demonstrates the reliability, reproducibility and accuracy of the NanoSampler accessory for the Zetasizer Nano series of instruments using PS latex standards.
Sample Preparation and Experimental Procedure
The sample preparation started with the preparation of a buffer by adding 100ml of ultra pure deionized water to 7 mL of a 0.92M NaCl solution. Around 20 mL of the buffer prepared was then mixed with 4 drops of a 60 nm Latex Sample (LTX3060A from Thermo Scientific). Then, 2 mL of buffer solution was taken and mixed with 7 drops of a 200 nm Latex Sample (LTX3200A from Thermo Scientific).
In this experiment, the size of two different polystyrene latex samples were measured using a combination of a Zetasizer NanoSampler (ZEN2000) equipped with a quartz flow cell and a Zetasizer Nano ZSP (ZEN5600).
The reproducibility of the results was assessed by the Zetasizer software (v 7.10) . The disposable plastic cuvette (DTS0012) was employed for batch measurements.
Experimental Results
Batch Measurements
The Zetasizer Nano facilitates batch measurements even if it is used in conjunction with the NanoSampler. The Zetasizer analyzed the samples in batch mode before performing automated measurements.
Three aliquots of 60 nm PS were repeatedly measured for 10 times. An overlay of the 30 measurements is illustrated in Figure 1. An overlay can be observed in the size distribution profile of the whole data set with a standard deviation of 0.287 (Table 1).
The data from 200 nm PS samples were also summarized in Table 1. Figure 2 depicts an overlay of every size distribution profile.
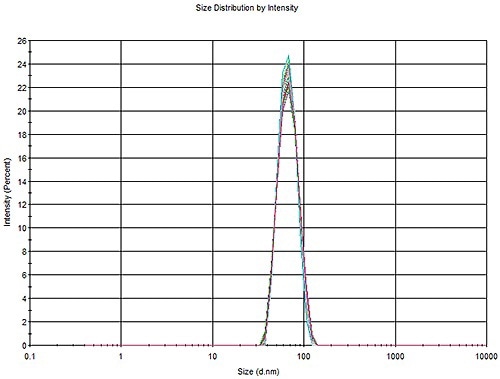
Figure 1. Overlay of 30 measurements of a 60 nm PS latex, three aliquots with 10 measurements each.
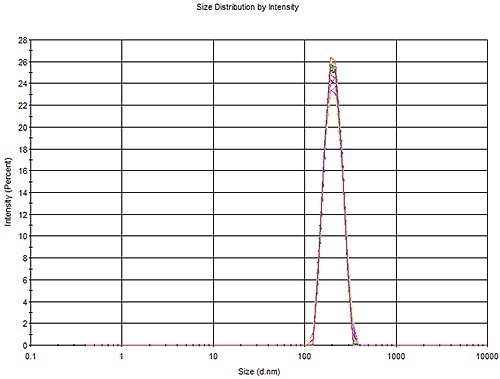
Figure 2. Overlay of 30 measurements of a 200 nm PS latex, three aliquots with 10 measurements each.
Table 1. Mean calculated Z-averages and standard deviation from batch measurements.
| Latex (manufacturers stated range) |
Mean Zetasizer Z-average |
Standard deviation |
| 60 (56.84 – 69.36) |
65.35 |
0.287 |
| 200 (194.04 – 210.12) |
202.7 |
0.961 |
Batch to Automated Transferability
For the two samples, aliquots were pipetted into 10 separate vials positioned in one of the two 48 vial capacity well plates placed within the NanoSampler. Each vial delivered three loadings to perform repeat measurements for ensuring statistical accuracy. The representative overlays in Figures 3 and 4 demonstrate the good agreement between the measurements involving the NanoSampler and the batch measurement results. Table 2 compares the results of batch measurements and automated measurements.
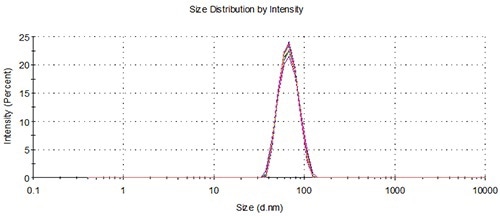
Figure 3. Overlay of distributions from representative batch and NanoSampler repeat measurements, 60 nm.
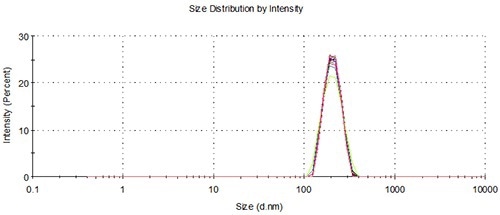
Figure 4. Overlay of distributions from representative batch and NanoSampler repeat measurements, 200 nm.
Table 2. Mean calculated Z-averages and standard deviation from batch measurements vs automated.
| Latex (manufacturers stated range) |
Mean Zetasizer Z-average |
Standard deviation |
| |
Batch |
NanoSampler |
Batch |
NanoSampler |
| 60 (56.84 – 69.36) |
65.35 |
65.09 |
0.287 |
0.285 |
| 200 (194.04 – 210.12) |
202.7 |
202.7 |
0.961 |
1.09 |
Aliquot to Aliquot Reproducibility
The aforementioned data ascertains the transferability and the reproducibility of the NanoSampler. Further data analysis given as below in Figures 5 and 6 and in Table 3 establishes the aliquot to aliquot reproducibility of the NanoSampler.
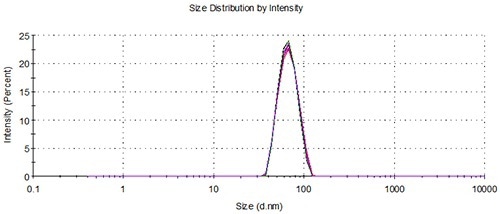
Figure 5. Overlay of distributions from 5 representative measurements of 3 aliquots from a single vial loaded using the NanoSampler, 60nm.
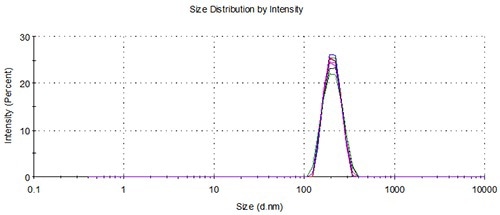
Figure 6. Overlay of distributions from 5 representative measurements of 3 aliquots from a single vial loaded using the NanoSampler, 200nm.
Table 3. Mean calculated Z-averages and standard deviation from multiple aliquots from same vial.
| Latex (manufacturers stated range) |
Mean Zetasizer Z-average |
Standard deviation |
| 60 (56.84 – 69.36) |
65.18 |
0.262 |
| 200 (194.04 – 210.12) |
202.3 |
1.477 |
Vial to Vial Reproducibility
Similarly, the vial to vial reproducibility of the NanoSampler is established as shown in Table 4 and Figures 7 and 8.
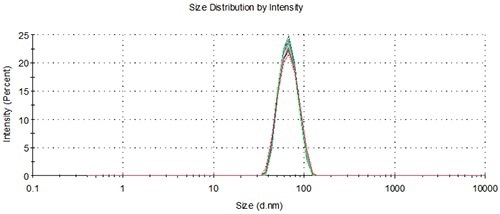
Figure 7. Overlay of distributions from a representative measurement of single aliquots from 10 vials loaded using the NanoSampler, 60nm.
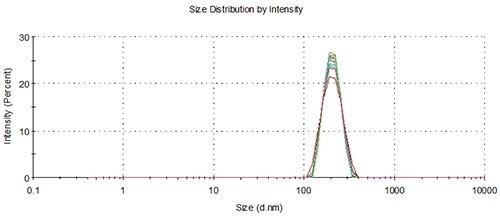
Figure 8. Overlay of distributions from a representative measurement of single aliquots from 10 vials loaded using the NanoSampler, 200 nm.
Table 4. Mean calculated Z-averages and standard deviation from single aliquots from multiple vials.
| Latex (manufacturers stated range) |
Mean Zetasizer Z-average |
Standard deviation |
| 60 (56.84 – 69.36) |
65.18 |
0.291 |
| 200 (194.04 – 210.12) |
202.1 |
1.367 |
Multiple Aliquots from Multiple Vials
The reproducibility of the NanoSampler for multiple aliquots from multiple vials is illustrated in Figures 9 and 10, and the results are summarized in Table 5.
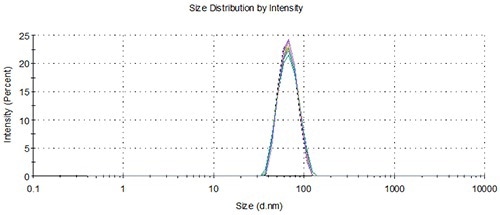
Figure 9. Overlay of distributions from representative measurements of 3 aliquots from 3 vials loaded using the NanoSampler, 60 nm.
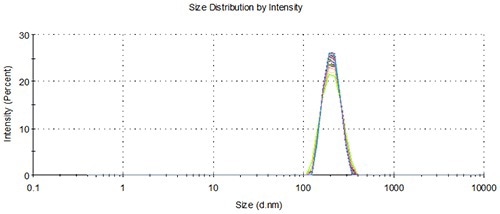
Figure 10. Overlay of distributions from representative measurements of 3 aliquots from 3 vials loaded using the NanoSampler, 200 nm.
Table 5. Mean calculated Z-averages and standard deviation from multiple aliquots from multiple vials.
| Latex (manufacturers stated range) |
Mean Zetasizer Z-average |
Standard deviation |
| 60 (56.84 – 69.36) |
65.21 |
0.280 |
| 200 (194.04 – 210.12) |
201.9 |
1.451 |
Large Data Sets
The Z-average diameter of every measurement that was performed on the two different PS sizes from all aliquots and all sample vials totaling 1260 runs is shown in Figure 11. In batch mode, the time taken for this volume of data would be 10 times longer. The average sizes determined were 65.2nm and 202.0nm, and are in the range of the expected tolerance of the latex standards.
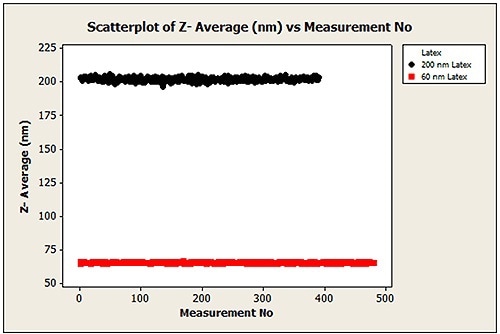
Figure 11. All data points measured using the NanoSampler (60 nm and 200 nm PS latex Z-average diameter)
Sample Carryover
Sample carryover is virtually eliminated (<0.05%), thanks to the flushing schedule of the NanoSampler. This is demonstrated Figure 12, showing an overlay of the final loading of a 200 nm PS latex subsequent to a run of 280 measurements, with the successive 60 nm. Figure 13 shows the zoom to baseline, revealing lack of any sample carryover.
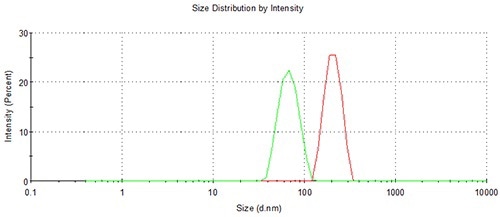
Figure 12. The lack of any sample carry-over using the NanoSampler is demonstrated by this overlay of adjacent 60 and 200 nm sample runs.
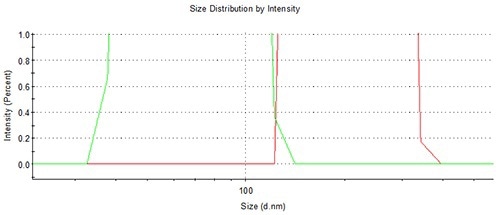
Figure 13. The lack of any sample carry-over using the NanoSampler is demonstrated by this zoom to baseline overlay of adjacent 60 and 200 nm sample runs.
Conclusion
As a compact sample delivery system, the Zetasizer NanoSampler enables highly accurate and reproducible automated sample loading into Zetasizer Nano instruments.
From the data, this versatile accessory is proven to be reliable to perform sample measurements automatically and achieve outstanding reproducibility from vial to vial and aliquot to aliquot.
In this way, the Zetasizer NanoSampler reduces operator time, improves sample throughput, and helps obtaining high quality, reproducible data.

This information has been sourced, reviewed and adapted from materials provided by Malvern Panalytical.
For more information on this source, please visit Malvern Panalytical.