The behavior and physical properties of polymers depend mainly on the properties of the polymer molecules themselves. This means that the properties of polymers will have an effect on the properties of end products manufactured from or comprising polymers.
Gelpermeation/Size-Exclusion Chromatography (GPC/SEC)
The molecular weight (MW), molecular size, molecular weight distribution, structure and intrinsic viscosity are parameters that impact the behavior of a polymer material. Gelpermeation or size-exclusion chromatography (GPC/SEC) is generally utilized to examine these aspects of synthetic polymers.
In GPC, the sample is separated as it passes through an inert yet porous chromatography column matrix. Although smaller molecules are able to enter the pores more deeply, larger molecules fail to do so and hence move through the column more quickly. The outcome is a separation based on hydrodynamic volume.
The fundamental data is just a concentration profile of the size-separated sample. However, by using a multi-detector GPC solution that integrates ultraviolet (UV), refractive index (RI), light scattering and intrinsic viscosity detectors, significant amount of data regarding a sample can be determined concurrently.
The Mark–Houwink plot is a powerful and useful tool and reveals the structural and MW relationship with excellent sensitivity. It is produced by plotting the MW determined from the light scattering detector against the intrinsic viscosity (IV) measured from the viscometer detector.
This article compares the structural distributions of common polymers using the Mark-Houwink plot. All data are produced with Malvern Panalytical’s OMNISEC system (Figure 1).
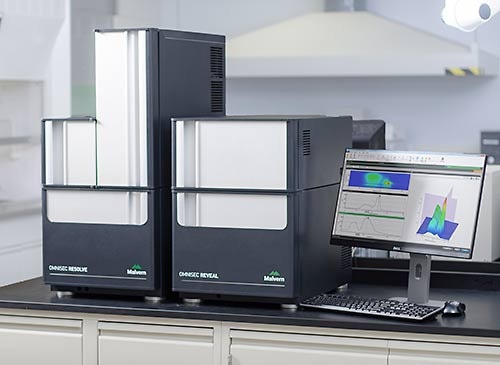
Figure 1. OMNISEC system, comprising OMNISEC RESOLVE (left) and OMNISEC REVEAL (right).
Materials and Methods
First, two Viscotek T6000M columns were used to isolate the samples. THF was the mobile phase that was stabilized with 300ppm BHT. In order to ensure complete dissolution, samples were made to dissolve overnight.
The OMNISEC unit was set up in the following manner:
- Column oven temperature: 35°C
- Autosampler temperature: 15°C
- Detectors temperature: 35°C
- Flow rate: 1.0mL/min
All data acquisition, data reporting, data analysis, and system control were carried out through the OMNISEC software v10. The four samples studied in this experiment are all wide distribution synthetic polymers such as polyvinylchloride (PVC), polycarbonate (PC), polymethylmethacrylate (PMMA) and polystyrene (PS).
Results
All four samples of polymers were chromatographed under these conditions. Figure 2 shows a triple chromatogram of all the four samples, in each case displaying the viscometer, RI and low angle light scattering (LALS) signals.
In Figure 3, the four RI chromatograms are superimposed to reveal the elution profiles and also to underline the variations between the polymers.
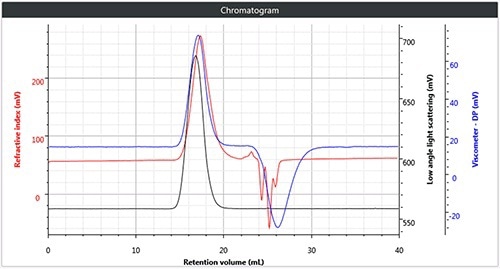
(a)
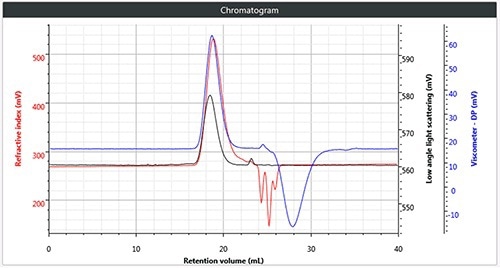
(b)
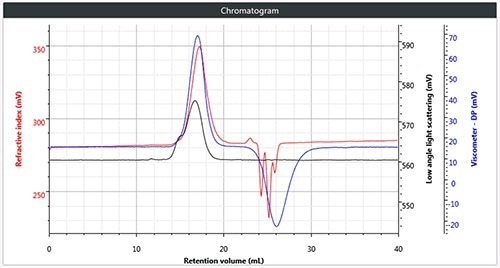
(c)
Figure 2. (a) Triple chromatogram of polystyrene; (b) triple chromatogram of polymethylmethacrylate; (c) triple chromatogram of polycarbonate; (d) triple chromatogram of polyvinylchloride.
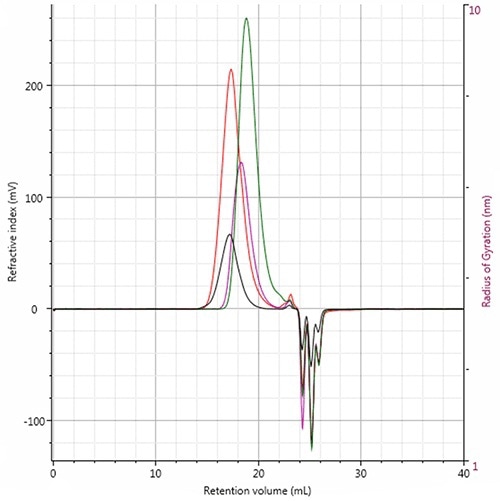
Figure 3. RI chromatogram overlay of all four polymer samples showing the elution profiles. Red: Polystyrene; Pink: PMMA; Green: Polycarbonate; Black: PVC.
Table 1 shows the measured data for the samples that reveal the absolute molecular weights determined from the LALS detector by means of the appropriate dn/dc for each type of polymer. It can be seen that the system provides values for the calculated hydrodynamic radius (Rh) and IV, in addition to other parameters including the average Mark-Houwink a and log k.
Table 1. Calculated data for samples showing absolute molecular weights
| Parameter |
Samples |
| Polyvinylchloride |
Polystyrene |
Polymethylmethacylate |
Polycarbonate |
| Retention volume (mL) |
17.220 |
17.363 |
18.343 |
18.850 |
| Mn (Da) |
81,930 |
108,300 |
57,323 |
10,189 |
| Mw (Da) |
202,910 |
250,890 |
101,840 |
27,270 |
| Mz (Da) |
563,930 |
428,720 |
147,950 |
41,603 |
| PD (Mw/Mn) |
2.477 |
2.317 |
1.777 |
2.676 |
| Intrinsic viscosity (dL/g) |
1.370 |
0.834 |
0.327 |
0.486 |
| Rhw (nm) |
15.281 |
14.103 |
7.776 |
5.672 |
Differences between the types of polymers can be clearly seen, with the PVC exhibiting the highest IVw value but the next lowest Mw value.
On the other hand, the average values for wide polymers do not often give a complete picture and hence it would be better to observe the structure across the entire MW distribution with the Mark-Houwink plot.
The Mark-Houwink plot of all four polymers (Figure 4) reveals the structural changes, with PMMA being lowest on the plot, and thus denoting that it has the highest density in solution. When compared to polystyrene, PC and PVC exhibit a lower density.
Though the average Mark-Houwink-a values are identical, some amount of changes can be seen, indicating that the PC actually has the most open structure across most of its distribution.
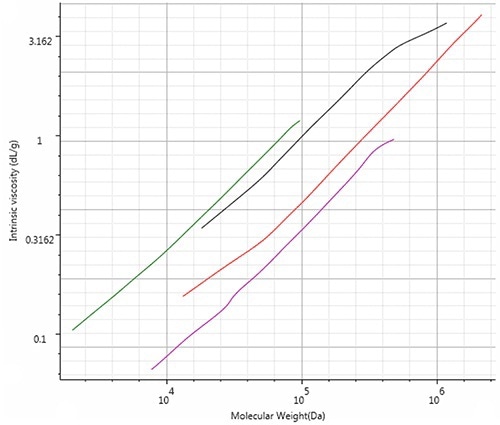
Figure 4. Mark-Houwink overlay of all four polymer samples showing the structural differences. Red: Polystyrene; Pink: PMMA; Green: Polycarbonate; Black: PVC.
In traditional GPC, the calibration built on polystyrene standards would give incorrect molecular weight values for all three polymers. In case a linear Mark-Houwink correction was used, the non-linear nature of the Mark-Houwink relationships would still give erroneous results.
Conclusion
This article shows how the four common polymers were studied easily and accurately. Malvern Panalytical’s OMNISEC system is designed to give high-quality polymer GPC data.
The integration of absolute molecular weight values from low-angle LS and IV data obtained from the viscometer design makes it possible to access the Mark-Houwink plot in more detail than ever before.
The information provided by this plot holds significance to all polymer chemists who want to gain a better insight into the polymer trends or changes in terms of structural changes and molecular weight independently from each other.

This information has been sourced, reviewed and adapted from materials provided by Malvern Panalytical.
For more information on this source, please visit Malvern Panalytical.