Determining the components, and their proportion, in a protein sample is essential for the improvement of candidate formulations and characterization of final formulations. This type of information can be traditionally acquired using Size Exclusion Chromatography (SEC) or Gel Permeation Chromatography (GPC).
SEC identifies sample components by their molecular weights through comparison of the movement of analyte molecules, via a size exclusion or gel permeation column, with that of a set of standards of known molecular weights. Additionally, it is possible to extract the relative amounts of each component from the respective peak areas. The elution is recorded using a concentration detector to determine the relevant extinction coefficients.
Column calibration SEC is a proven technique, but it can introduce inaccuracies into the analyzes via shape-dependent elution. Conversely, multi-detection SEC, equipped with the resolving power of chromatography and the revealing power of light scattering detectors and a viscometer, yields more accurate data and a more comprehensive characterization of protein mixtures of interest. This article demonstrates the supremacy of multi-detection SEC over column calibration by illustrating the characterization of two antibody samples.
Materials and Procedure
Column calibration standards were prepared in phosphate buffered saline (PBS, pH 7.4) at final concentrations of roughly 1-3 mg/mL using an exclusion marker and a protein molecular weight marker kit consisting of six globular proteins. This was followed by the preparation of two polyclonal immunoglobulin G samples (IgG) from different organisms in PBS at final concentrations of 2-3mg/mL.
A 0.2 µm cellulose acetate membrane was used to filter all the samples. For the most volume-economic sample delivery, the microliter pickup mode was used to apply three replicate injections of 100 µL to the size exclusion column set (2x Viscotek P3000, Malvern Panalytical). An OMNISEC system was used to perform all of the measurements at a 1 mL/min flow rate using PBS as the mobile phase. The data acquisition was performed by maintaining the sample tray, detector compartments, and column at 25°C.
Experimental Results
IgG Chromatograms: Refractive Index
A refractive index detector was used to monitor the elution profiles of two IgG samples (Figure 1). The samples were qualitatively compared and their relative compositions were discerned by overlaying the chromatograms. Using the size exclusion theory, the peaks upstream of the main peak with a retention volume (VR) at roughly 16.0 mL represent the aggregates of the IgG monomer, which have a progressively larger hydrodynamic size. Conversely, the minor peaks downstream from the main peak likely represent salt molecules with small hydrodynamic radii.
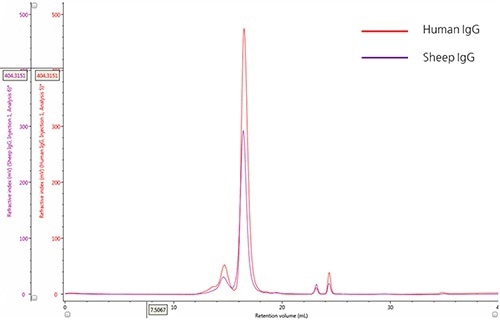
Figure 1. Overlay of representative RI chromatograms of human IgG (red) and sheep IgG. (purple)
IgG Sample Characterization by SEC column Calibration
Plotting of the logarithm of the molecular weight (Log Mw) for each protein standard was done as a function of the ratio of the protein retention volume to the column void volume (Vo). Calibration parameters were obtained by linearly fitting the data and were used to calculate the molecular weights for peaks in the chromatograms of IgG samples (Figure 2).
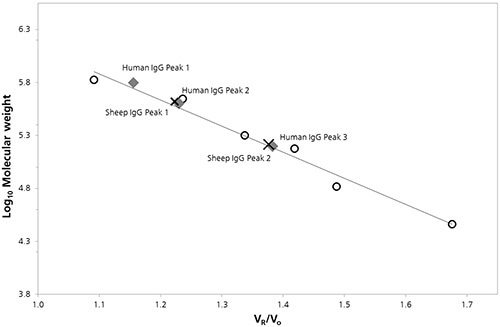
Figure 2. SEC Column calibration curve with sheep (cross) and human (diamond) IgG data superimposed.
Table 1 summarizes these calculated Mw values and other quantitative attributes determined by column calibration:
Table 1. Summary of results from SEC column calibration.
| |
Human IgG |
Sheep IgG |
| Peak 1 |
Peak 2 |
Peak 3 |
Other |
Peak 1 |
Peak 2 |
Other |
| VR (mL) |
13.80 |
14.69 |
16.51 |
> 13.00 |
14.60 |
16.44 |
> 13.80 |
| Mw (kDa) |
627.2 |
398.9 |
158.1 |
- |
417.6 |
163.8 |
- |
| Identity |
tetramer |
n/d |
monomer |
Higher order aggregate |
n/d |
monomer |
Higher order aggregate |
IgG Sample Characterization by Multi-Detection SEC
Table 2 summarizes the quantitative properties of human and sheep IgG samples acquired using multi-detector SEC, showing good agreement between the absolute Mw values estimated for Human IgG Peaks 1-3 and the expected values for the trimer, dimer and monomer species. Likewise, the corresponding Mw values identified for sheep IgG Peaks 1 and 2 are in line with monomer and dimer species.
Table 2. Summary of the results from multi-detector SEC.
| |
Human IgG |
Sheep IgG |
| Peak 1 |
Peak 2 |
Peak 3 |
Other |
Peak 1 |
Peak 2 |
Other |
| Mw (kDa) |
459.0 |
299.5 |
147.5 |
722.8 |
306.7 |
152.0 |
551.7 |
| Pd |
1.0008 |
1.0002 |
1.0002 |
1.0334 |
1.0010 |
1.0002 |
1.0697 |
| Rh (nm) |
8.2 |
6.7 |
4.8 |
11.0 |
6.8 |
5.0 |
8.8 |
| IV (dL/g) |
0.086 |
0.068 |
0.049 |
0.159 |
0.064 |
0.051 |
0.097 |
| Identity |
trimer |
dimer |
monomer |
Higher order aggregate |
dimer |
monomer |
Higher order aggregate |
| % Composition |
2.4 |
11.4 |
84.9 |
1.3 |
11.6 |
85.6 |
2.8 |
The viscometer data allows calculating the hydrodynamic radii of both IgG monomers. The respective elution order of the two IgG samples is rationalized when these values are compared (Figure 3). The variations in aggregate composition between the two molecules can also be observed. The higher trimer proportion in the human sample when compared to the sheep sample may reveal variations in the stability or routes of aggregation for this sample, thus demanding further analysis.
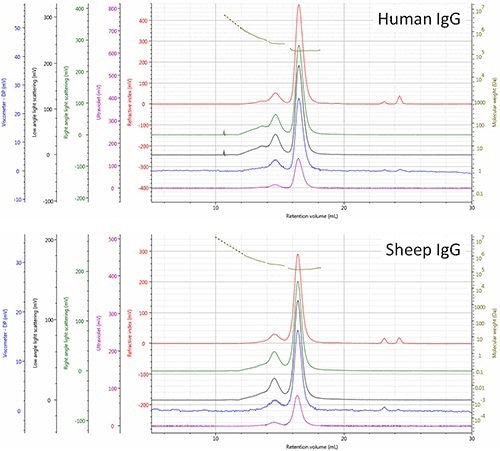
Figure 3. Multi-detector SEC chromatograms of human and sheep IgG samples - refractive index (red), right angle light scattering (green), low angle light scattering (black), viscometer (blue), ultra violet (purple). The molecular weight of species is shown in olive.
Shape-Dependent Inaccuracies in Column Calibration SEC
From the results, the molecular weight values obtained with column calibration SEC are higher than multi-detector SEC values. For peaks representing the monomer (in both cases), the monomer species can be identified from the Mw. Conversely, in aggregate peaks such as the dimer, the deviation of the Mw values from the expected values is as much as 28%, defying identification with any certainty.
These inaccuracies are due to the effect of shape on the elution of antibody molecules and their aggregates via the column matrix. From the size exclusion theory, hydrodynamic volume governs a protein molecule’s column permeation characteristics, and is a function of structure and mass. Hence, a protein of a specific molecular weight can have a smaller or equivalent hydrodynamic volume of a protein of lower molecular weight with densely packed atoms and elongated structure.
The construction of calibration curves using a chain of these two differently shaped molecules would result in different slopes. The application of globular proteins in column calibration imparts an assumption of globular shape onto the samples. However, if the antibody structure is Y-shaped instead of globular, this assumption leads to erroneous molecular weight values with increasing molecular size.
Conclusion
The results clearly demonstrate the supremacy of multi-detector SEC over column calibration SEC. The multi-detector SEC provides conclusive assignment of all discrete peaks to specific oligomeric states, and facilitates the discerning and quantifying of variations in the aggregation states between the samples. This data helps biopharmaceutical manufacturers to determine and gain insights into the behavioral characteristics of various candidates in a variety of formulations, or under various conditions. As a result, production and efficacy of final drug products can be effectively controlled.
Malvern Panalytical's OMNISEC system has a sensitivity to measure samples of a few micrograms or less. In addition, samples can be injected without wastage using the autosampler of the OMNISEC system, and can be maintained in a cool condition to avoid aggregation of the sample while waiting for measurement. These features make the OMNISEC system suitable to characterize biopharmaceuticals and proteins.

This information has been sourced, reviewed and adapted from materials provided by Malvern Panalytical.
For more information on this source, please visit Malvern Panalytical.