The automotive and aircraft industries often use aluminum alloys as they combine the mechanical properties of alloys, and the light weight aspects of the aluminum. The composition of the elements is vital for alloy properties, as even trace quantities of additives can impact the material’s thermal and mechanical properties.
Micro-X-ray fluorescence spectroscopy (micro-XRF) in the scanning electron microscope (SEM) used in the study of aluminum alloys is promising because of the higher sensitivity of detection of elements (Z > 20). This article illustrates the improvement of the detection of trace elements in a certified alloy of aluminum (Alcoa Deltalloy® 4032, Figure 1.) using micro-XRF on SEM
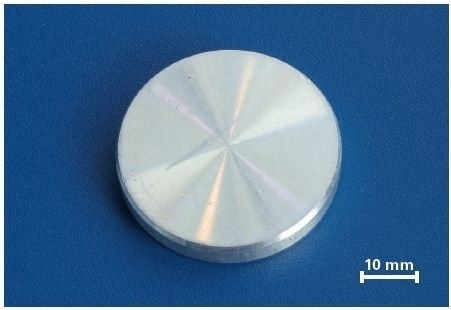
Figure 1. Photograph of the analyzed specimen Alcoa Deltalloy® 4032.
Methods
A focused source of X-ray photon, XTrace, facilitates the performance micro-XRF in a SEM. This dual working system enables SEM to detect trace elements at the parts per million (ppm) level. The X-ray source on the SEM enhances the detectability of elements with an atomic number higher than 20, compared with SEM-EDS. A decreased spectral background is the result of photon excitation as there is no generation of bremsstrahlung in the sample, compared to the excitation of an electron. The data shows a better peak ratio to background ratio. In addition to the possibility to effectively excite the high energy lines over 15 keV, the problems that occur from overlap between neighboring peaks are reduced.
The limit of detection using micro-XRF can be as low as 10 ppm (µg/g). The sample matrix and the element influence the limit of detection (Figure 2). To study comparatively EDS can be used only to detect trace elements that are as low as 1000 pm (0.1 mass%). Generally the detective sensitivity for elements that are heavier than calcium is higher when micro-XRF is used instead of an electron beam (Figure 2). The excitation of X-ray gives information regarding the composition of the sample surface, much like SEM, but it also provides information from a depth of several microns.
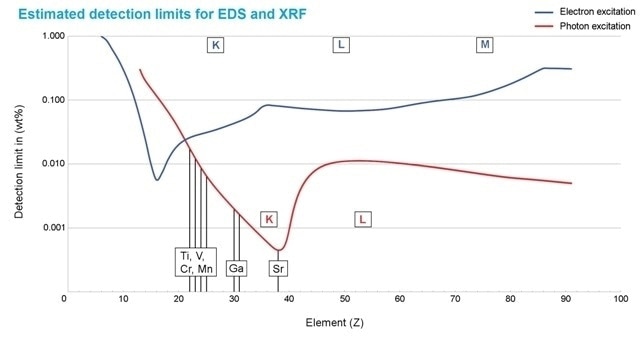
Figure 2. Estimated detection limits for photon excitation (red) and electron excitation (blue). They depend on the element and the matrix composition. In general, Micro-XRF improves the detectability of elements above atomic number 20 (calcium) - compared to SEM EDS. Only Micro-XRF detects the elements shown in black, their concentration is below or close to the limit of detection for electron excitation.
Conditions for Measurement
A SEM was integrated with a Bruker QUANTAX system with a 30 mm² active area silicon drift detector (SDD) XFlash® 6I30 with energy resolution of 123 eV for Mn Ka and XTrace source with an Rh-anode X-ray tube. Electron excitation was performed using SEM, and photon excitation was completed using XTrace. X-rays that were generated from both of these sources, electron excitation and photon excitation, were detected using XFlash® SDD.
The analysis required a 10-point spectrum, with each of the techniques on the same area of the sample using consecutive and separate photon and electron excitation. A fundamental, standardless algorithm parameter was used in the quantification of XRF. The results of EDS quantification were acquired using the quantification method of peak-to-background (P/B-ZAF). The summary of the measurement conditions and elements detected using both methods of excitation are given in Table 1.
Table 1. Measurement conditions and detected elements in a certified aluminum alloy. Elements in red were only detected with Micro-XRF.
| Excitation |
Voltage, current |
Input count rate (ICR) |
Acquisition time |
Detected elements |
| Electrons (SEM) |
20 kV |
10.7 kcps |
200 s |
Mg, Al, Si, Cr, Fe, Ni, Cu, Zn |
| Photons (XTrace) |
50 kV, 600 µA |
9.5 kcps |
200 s |
Mg, Al, Si, Ti, V, Cr, Mn, Fe, Ni, Cu, Zn, Ga, Sr |
Results
The elements such as Al, Mg, Cr, Si, Ni, Fe, Zn and Cu were present in the certified alloy of aluminum using EDS as well as micro-XRF (Table 1, Figure 3). Other trace elements were present in the sample. Ti, Mn, V, Sr and Ga were the elements that were exclusively isolated using micro-XRF. The ratio of signal to noise is much better with lower detection levels of micro-XRF (Figure 2), facilitating the detection of Fe, Cr, Cu, Ni and Zn.
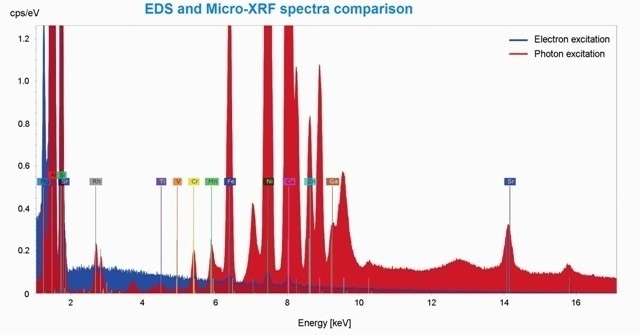
Figure 3. Comparison of EDS (blue) and Micro-XRF (red) spectrum. The element peaks of Ti, V, Mn, Ga and Sr are only present in the Micro-XRF spectrum. The Rh-lines derived from the scattered XRF-tube spectrum. Unlabeled peaks are diffraction peaks.
The results of standardless quantification for XRD and EDS are displayed in Table 2. The quantification of only Al, Mg, Fe, Si, Zn, Cu and Ni using EDS is possible. The quantification of Zn could only be done in 4 out of 10 runs, as it was beneath the limit of detection for the other six analytical runs of EDS.
Table 2. Comparison of the EDS and Micro-XRF quantification results with the certified values, element concentration in mass% normalized (b.d. = below limit of detection, n.d. = not detectable)
| |
Mg |
Al |
Si |
Ti |
V |
Cr |
Mn |
Fe |
Ni |
Cu |
Zn |
Ga |
Sr |
| EDS mean concentration value |
1.20 |
85.09 |
11.43 |
n.d. |
n.d. |
b.d. |
n.d. |
0.36 |
0.91 |
0.91 |
0.10 |
n.d. |
n.d. |
| Micro-XRF mean concentration value |
0.85 |
83.87 |
12.83 |
0.03 |
0.01 |
0.06 |
0.03 |
0.36 |
0.93 |
0.93 |
0.10 |
0.01 |
0.03 |
| Certificied values |
1.1 |
84.52 |
12.00 |
0.011 |
0.0099 |
0.051 |
0.033 |
0.31 |
0.89 |
0.89 |
0.098 |
0.02 |
0.026 |
The quantification of the micro-XRF spectrum was achieved with a standardless fundamental parameter method. The results of this quantification illustrate the element sensitivity of XTrace. The elements V, Ti, Mn, Cr, Sr and Ga were detectable and quantified using micro-XRF, even though the element concentration was below the detection limit of EDS of 0.1 mass%.
Though chromium was detected with EDS, it could not be quantified using this method as its concentration was below the detection limit of EDS. In contrast, chromium can be detected and quantified using micro-XRF, due to its better detection limit. The comparison of the results of quantification obtained from micro-XRF and EDS to the aluminum alloy’s certified values is illustrated in Table 2. It is observed that the results of quantification for most elements using XRF and EDS are in close proximity to that of the certified values.
A diffraction peak overlap caused a slightly larger variation for Ti concentration between the certified value and micro-XRF result.
Conclusion
Due to its high element sensitivity, five additional elements such as V, Ti, Mn, Sr and Ga were detected exclusively in a certified alloy of aluminum using Micro-XRF. Micro-XRF’s high sensitivity for element detection is due to a lower background, lack of bremsstrahlung, and a peak that is higher to the background ratio when compared to electron excitation, so better sample characterization is possible with micro-XRF. The results of standardless quantification using EDS and Micro-XRF are close to that of the certified values. XTrace serves as a complementary analytical tool for a SEM to enhance the detectability of trace elements.
This information has been sourced, reviewed and adapted from materials provided by Bruker Nano Analytics.
For more information on this source, please visit Bruker Nano Analytics.