Historically, archeologists used to carry out use-wear studies involving quartzite and quartz, but these metals are considerably less in numbers. Further, not much effort has been made to measure use-wear on quartzite-based stone tools. The aim of this case study is to establish the efficiency of a laser scanning confocal microscope (LSCM) for the purpose of recording the surface roughness of Mistassini quartzite scrapers applied on two varied contact materials – dry and fresh deer hide. The Evident LEXT OLS4000 was used as an LSCM measurement system in this case study.
Mistassini quartzite is a very light gray stone or fine-grained opaque white with irregular streaks of dark gray to black. It is usually related to a geological formation called Colline Blanche. A mathematical algorithm was used in this study, which helped to differentiate surface roughness depending on comparisons at various scales.
Here, measures of the relative area (RelA) combined with the F-test were utilized to distinguish worn stone tool surfaces from unworn ones, and also surfaces of quartzite scrapers applied on fresh and dry deer hide. The outcomes show the influence of raw material difference on the use-wear formation and its subsequent documentation through the combination of RelA and LSCM.
RelA, the area-scale fractal analysis algorithm for surface characterization was used such that RelA represents the ratio of the calculated area (CA) of the quantified surface divided by that surface’s nominal area (NA). The F-test was then used to statistically compare RelA. It also compares the difference within individual data sets to the differences present between the datasets to analyze the importance of these differences.
Methodology
In this case study, four scrapers were examined that were produced and applied as part of a previous study on the ancient usage of Mistassini quartzite in southern Quebec, Canada (Figure 1). Two of the quartzite scrapers used were produced from one Mistassini quartzitecore (called Core A), whereas the other two were produced from another core (called Core B) (Figure 2)
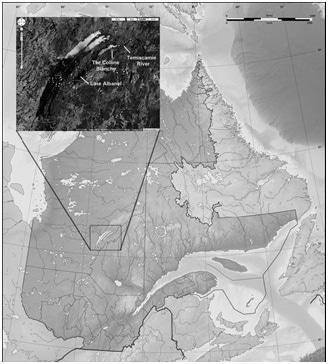
Figure 1. Map of the source location of Mistassini quartzite in the Colline Blanche formation, central Quebec, Canada.
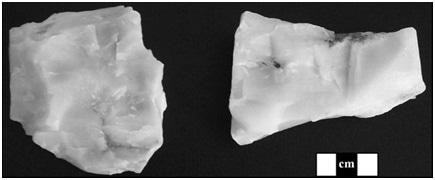
Figure 2. Coarser-grained Mistassini quartzite (left) and finer-grained Mistassini quartzite (right).
Despite the acquisition from the same outcrop, Core A has a coarser-grained crystalline structure as opposed to Core B, this shows the kind of intra-source difference observed above. A scraper made from these two cores (Core A) was applied on fresh hide (FH1, FH2) or dry hide (DH1, DH2) (Table I). The distal edge angles of the scrapers spanned from about 78° to 84°.
Table 1. One scraper produced from each of the two cores was used on either dry hide (DH1, DH2) or fresh hide (FH1, FH2).
| Experimental Mistassini quartzite Scrapers |
| Core no. |
Tool no. |
Distal edge angle (mean) |
Contact material |
Length of use |
Used/unused region no. |
No. of area scans |
| Core A |
DH2 |
84° |
Dry deer hide |
120 min |
UDH2/NDH2 |
6/6 |
| Core A |
FH1 |
78° |
Fresh deer hide |
120 min |
UFH1/NFHI |
6/6 |
| Core B |
DH1 |
80° |
Dry deer Me |
120 min |
UDH1/NDH1 |
6/6 |
| Core B |
FH2 |
81° |
Fresh deer hide |
120 min |
UFH2/NFH2 |
6/6 |
The four flakes that were distally retouched were hafted in straight wooden handles measuring 15 to 18 cm in length. At one end, the handles were slotted and another piece of wood was perpendicularly fitted to the handle length at the bottom of the slot so that the scraper is fully secured in its haft.
The scraper, the handle, and the smaller piece of wood were held together using a woodworking adhesive; a coated linen thread was utilized to bind and additionally immobilize each scraper in its handle. The dry and fresh deer hides were stretched across the plywood sheets and fixed to limit their movement during usage. Both the mounted dry hide and the fresh hide were scraped on a lab floor and on a wet lab table respectively to accommodate the soft tissue and removed fat (Figure 3).
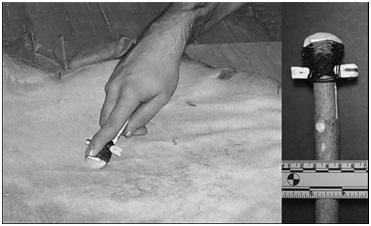
Figure 3. Hafted quartzite scraper (DH1) used to scrape dry deer hide mounted on a plywood board.
The hide was scraped in a controlled way, with each tool user leaning over a specified scraper to apply a comparable load on individual tools. The users also kept a steady ‘implement-to-working-surface’ stroke and angle rate to improve the reliability of tool use activity. The original experiment was restricted to transverse unidirectional motions, where the edge of the tool was drawn toward the tool-user in a continuous one-stroke movement at 45° working angle. The tool edge was collected after spanning a 15 cm distance with each stroke, and the movement was continued until the experiment time elapsed (Figure 4).
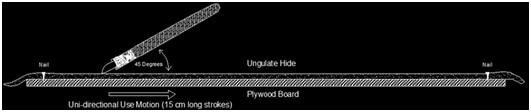
Figure 4. Schematic diagram of the setup used for experimental use of the quartzite scrapers.
Each tool was utilized at a speed of one stroke per second, with a total number of 7200 strokes following 2 hours of use. Here, experimental variables could have been controlled with a mechanical system to simulate scraping, but human element was used to improve the interpretive value for later comparisons to specimens that were archeologically recovered.
Ethnoarcheological studies indicate that scraping hides mounted in wooden frames or on ground surfaces may simulate past activity in a more precise way. These components may be integrated into the hide-scraping process to create a more authentic comparative use-wear in future experiments utilizing quartzite scrapers.
An Evident LEXT OLS4000 LSCM was used to measure the replicated scrapers after 2 hours of use for each tool. Following the preliminary scraping experiments, all tools were made to undergo a multistage cleaning routine to enable consistent and precise examinations of wear accrual patterns. In this process, each tool is washed in a mixture of mild detergent and warm water to remove debris and residues, followed by physical cleaning of the tools with a 30% sodium hydroxide solution.
Finally, the tools are washed with distilled water to remove contamination related to prior handling of the implements. The quartzite scrapers were taken off from their handles and again washed in a mixture of a mild grit-free detergent and warm water, and finally rinsed and allowed to air dry. A Stemp Unitron MS-2BD metallographic microscope was then used to examine the four tools at 200x magnification under incident light to check for sufficient cleaning and also to detect the regions to be scanned (Figure 5).
In order to make sure that the experimental use of the scrapers is precisely documented, all individual tools were bagged separately and all the related data was recorded, such as stroke count, use duration, activity type, and a plan-view diagram of the tool suggesting the part of the edge that was applied.
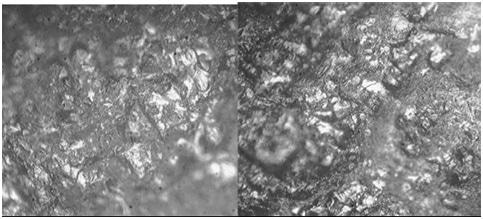
Figure 5. Photomicrographs of the surfaces of scrapers used on fresh hide (UFH1) (left) and dry hide (UDH1) (right) at 200x magnification. The fresh hide polish appears bright and “liquid-looking” on the higher microtopography of the crystal surfaces with minimal reticular polishing of the lower microtopography. The dry hide polish is both matte and pitted in appearance, with a much more reticular distribution on the lower microtopography; the higher microtopography has bright and flat polish zones on the crystal surfaces and lacks the “liquid” or “greasy” look of fresh hide polish. The width of each photomicrograph is approximately 400 µm.
LSCM, similar to other technology like infinite focus microscopy and AFM, helps the actual surface of the stone tool just like metallurgical microscopes and creates a 3D scanned image of the viewed surface depending on the mathematical documentation of the diverse surface elevations of the surface on a microscale (Figure 6).
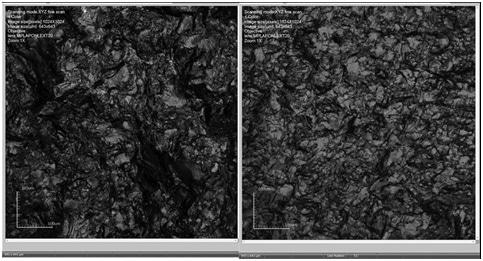
Figure 6. LEXT OLS4000 screen shots of area scans (20x objective) of the surfaces of scrapers used on fresh hide (UFH1) (left) and dry hide (UDH1) (right). The x- and y-axis dimensions are 643 x 643 µm2 (1024 x 1024 pixels).
For surface measurement, images are produced by an LSCM utilizing reflected laser light from a separate focal plane. A topographical structure is recorded using the laser light, which is reflected back from the quantified surface from the focal plane via a pinhole aperture placed before a photomultiplier. The wavelength of the incident light, which is reflected back from the quantified surface and the pinhole aperture diameter establish the depth of individual focal slice used for recording elevation.
The incident light is generated by the LEXT OLS4000 utilizing a 405 nm laser, which is scanned across the calculated surface through a micro-electromechanical resonant Galvano mirror. The objective lens integrated on a motorized head directs the laser onto the surface points of changeable vertical distance to create slices of calculated sections of the surface. Using these slices, a 3D digitized map of the scanned surface is mathematically produced. The OLS4000 has a height display resolution of 1.0 nm and a vertical scale (z-axis) resolution of 0.8 nm. It comprises of a host of objectives ranging from 20x to 100x, and the 20x objective was utilized to document the experimental surface. The number of vertical slices that can be removed by the laser will differ based on the objective used, the peak-to-valley distance on the surface, and the pitch setting set at 0.06 to determine the surfaces of quartzite scraper.
Surface Roughness and Relative Area (RelA)
Several fractal analysis programs are now available, but here the RelA for surface characterization was selected. This algorithm measures the change in the measured or apparent area, in regard to the scales of calculation or observation by a set of virtual tilings (Figure 7).
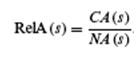
CA(s) refers to the number of tiles utilized in a tiling exercise at a specific scale (s), multiplied by the area of the tiles utilized in that tiling exercise (that specific area scale (s)). The NA(s) refers to the nominal or projected x times y area which is tiled in that specific scale (s). With each tiling exercise the NA differs somewhat, because only full tiles are utilized, all with the same area, s, in a specific tiling exercise.
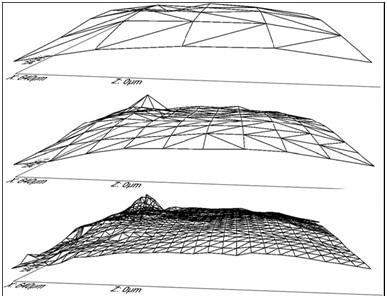
Figure 7. Area-scale analysis using tilings shown on three identical simulated surfaces. The surface areas are covered by 32 (top), 162 (middle), and 1355 (bottom) tiles giving calculated areas (CAs) of 12,109, 2450, and 282 µm2, and relative areas (RelAs) of 1.0002, 1.0004, and 1.000756.
Surface Scans Using LSCM
Following cleaning, individual quartzite scrapers were separately mounted on the OLS4000’s motorized stage for surface measurement. In both worn and unworn regions of quartzite scrapers, six varied area scans were obtained for a total of 48 area scans, 12 for each tool. In order to measure the changes in surface roughness, each area scan location quantified on each quartzite scraper was measured in relation to RelA on a log scale. This data was processed using the Sfrax software.
Before measuring RelA, the Sfrax software was used to level the surface scan data and the same was passed via the slope filter, which was set to 80°. Using the F-test, RelAs were compared to establish whether it is possible to differentiate the surface roughness. In the experimental analysis, the scales where there is a high confidence level are the scales at which the tools can be differentiated depending on RelA measures.
Experimental Results
These results show that LSCM is suitable to record surface roughness on quartzite tools. Combined with Sfrax software, the data obtained from the quartzite surface area scans shows that as the scale of calculation decreases, the RelAs for both worn and unworn surfaces for all regions increase, as shown for the second scraper (FH2) utilized on fresh hide (Figure 8). The RelAs are close to one at the longest scales, suggesting that the scale of calculation is greater than the texture features. The RelAs deviate considerably from one as the scale decreases. This transition is called the smooth-rough crossover.
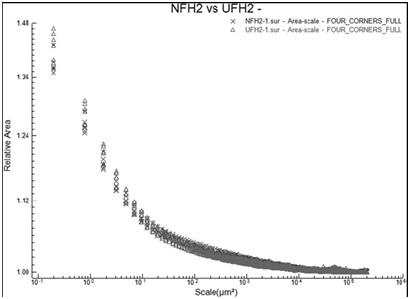
Figure 8. The relative areas vs. scale for the six area scans in the used (Δ = UFH2) regions and the six area scans in the unused regions (x = NFH2) of the quartzite scraper (FH2) used on fresh hide.
The RelA measures can be utilized to differentiate used surfaces from unused ones on the same tool; however, a better indicator of differentiation integrates the mean square ratios or MSRs of these RelAs. This algorithm shows that for each of the four scrapers, differentiation of the worn and unworn regions can be achieved over the 95% confidence level, but the scales over which differentiation can be achieved will alter by the tool. For instance, differentiation of the worn against unworn regions on scraper FH2 can be obtained at coarse and fine scales through the F-test (Figure 9), while for scraper DH2, this can be achieved only at fine scales (Figure 10).
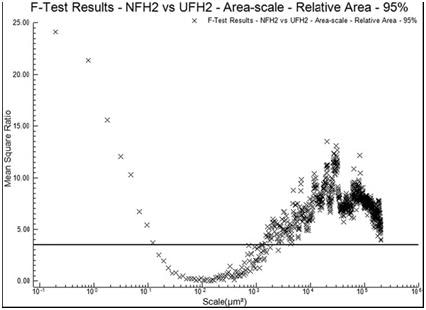
Figure 9. The MSRs for the relative areas of the unused vs. used regions of a scraper (FH2) used on fresh hide. The horizontal line indicates 95% confidence level for discrimination.
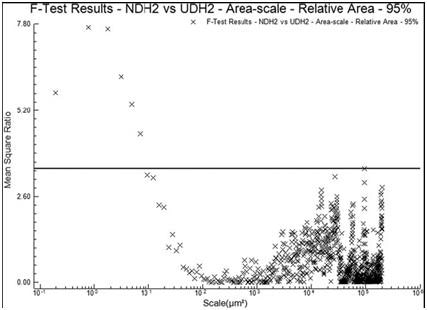
Figure 10. The MSRs for the relative areas of the unused vs. used regions of a scraper (DH2) used on dry hide. The horizontal line indicates 95% confidence level for discrimination.
At the finest scales, it is possible to differentiate two tools that are utilized on the same contact material (Figure 11). On comparing the MSRs for the used surfaces of the two tools applied for scraping fresh hide to those of the two dry hide scrapers, it was seen that the RelAs (Figure 12) can distinguish surface roughness over the 95% confidence level at various scales, particularly at fine and coarse scales starting at 102 µm2 and 105 µm2, respectively. This data shows that surface roughness resulting from wear created by tools applied on varied contact materials can be quantified and discriminated independently.
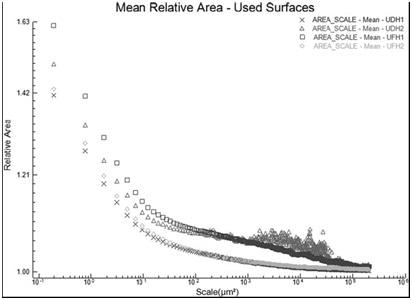
Figure 11. The mean relative areas vs. scale for the six area scans in the used regions of the two scrapers used on dry hide (x = UDH1, Δ = UDH2) and the two scrapers used on fresh hide (? = UFH1, ◊ = UFH2).
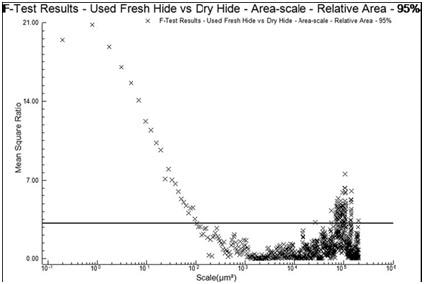
Figure 12. The MSRs for the relative areas of the two scrapers used on fresh hide (UFH1, UFH2) vs. the two scrapers used on dry hide (UDH1, UDH2). The horizontal line indicates 95% confidence level for discrimination.
Conclusion
The results show how the LSCM coupled with RelA can be effectively used to document and differentiate surface roughness on Mistassini quartzite-based stone tools. LSCM offers an independent way to consistently determine used and unused surfaces on another type of silicate stone. When combined with suitable software, surface roughness data can be compared at multiple measurement scales such that discrimination of worn and unworn regions on quartzite scrapers is possible. With the combination of RelA and LSCM, archaeologists can easily study the previous applications of chipped quartzite artifacts. While this method would need to be further tested on additional quartzite-based tools, preliminary experimental data have given positive results that will facilitate future work focused on the measurement of lithic use-wear. With more tests being carried out on varied contact materials, a better understanding of use-wear characteristics and use-wear accrual can be obtained with respect to the quantification of used quartzite tool surfaces.

This information has been sourced, reviewed and adapted from materials provided by Evident Corporation - Industrial Microscopy.
For more information on this source, please visit Evident Corporation - Industrial Microscopy.