Active Pharmaceutical Ingredient (API) and excipients such as binders, lubricants, and fillers are the various ingredients present in pharmaceutical tablets. In order to create a homogenous mixture, the process of blending is employed in tablet manufacturing to blend the excipients and the APIs together.
The blending process control is a significant yet challenging process that determines the quality of the final product. Characterization or detection of final blend homogeneity and raw material types make the blending process control difficult.
USFDA established pharmaceutical manufacturing process control guidance states that every batch containing APIs and processed through a blend should meet the set purity standards. Batches containing dry blended APIs must show homogeneity in blending validation.
Experiment
In this experiment, chemometrics and Raman spectroscopy were employed to develop an analytical method capable of quantifying the API Naltrexone HCl in the final product 3 mg tablets, and in the blended powder mixtures. The samples used for the experiments are shown in Table 1.
Table 1. Samples
| Sample |
Naltrexone HCl (mg/tablet) |
|
| 1 |
100% Naltrexone HCl powder |
feasibility evaluation |
| 2 |
2.70 (mg/tablet) powder |
chemometric model |
| 3 |
2.85 (mg/tablet) powder |
| 4 |
3.00 (mg/tablet) powder |
| 5 |
3.06 (mg/tablet) powder |
| 6 |
3.14 (mg/tablet) powder |
| 7 |
3 mgT1 |
prediction |
| 8 |
3 mgT2 |
Ani-Raman Plus® has a fiber optic probe and a 785 nm laser excitation, and was used for the experiment. In order to provide stability for data collection and sampling, a probe holder was used. This is necessary to achieve accuracy in the chemometric model.
Spectra were collected in plastic bags from all the samples at three different places. The measurements were taken at -300 mW or 100% laser power, with an integration period of 6 seconds. Chemometric analysis was conducted using BWIQ software.
Chemometric Analysis
The Raman spectra for samples with varied levels of API concentrations to 100% are shown in Figure 1. The Raman peaks of Naltrexone HCl are distinct in the Raman spectra of various samples that were used to develop the chemometric model.
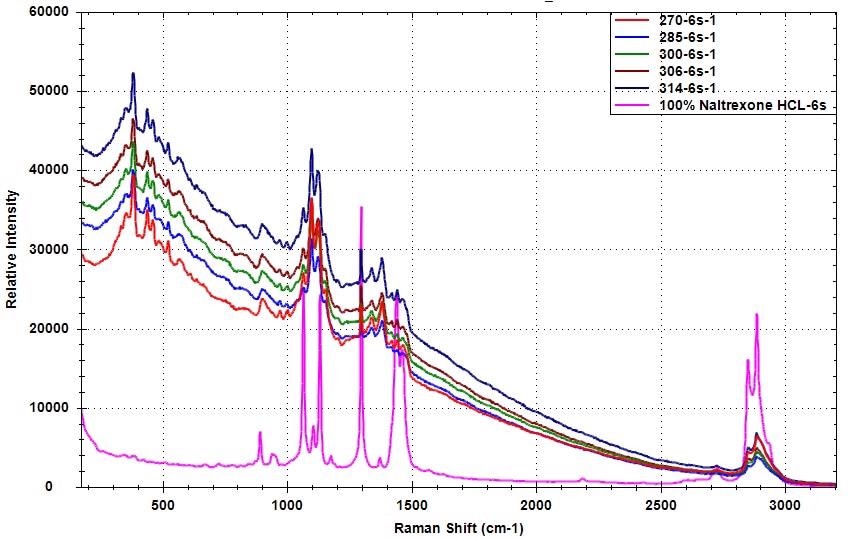
Figure 1. Raman spectra of samples with different Naltrexone HCl concentration compared to pure Naltrexone HCl
Collecting numerous spectra from various places of the sample enables users to consider the API uniformity in the blending mixture. It also allows users to incorporate a more comprehensive picture of the mixture into the chemometric model.
The information was baseline-corrected through an adaptive iteratively reweighted Penalized Least Squares (airPLS) algorithm available in the BWIQ software, to eliminate the fluorescence variability. The background removal for a single spectrum is shown in Figure 2.
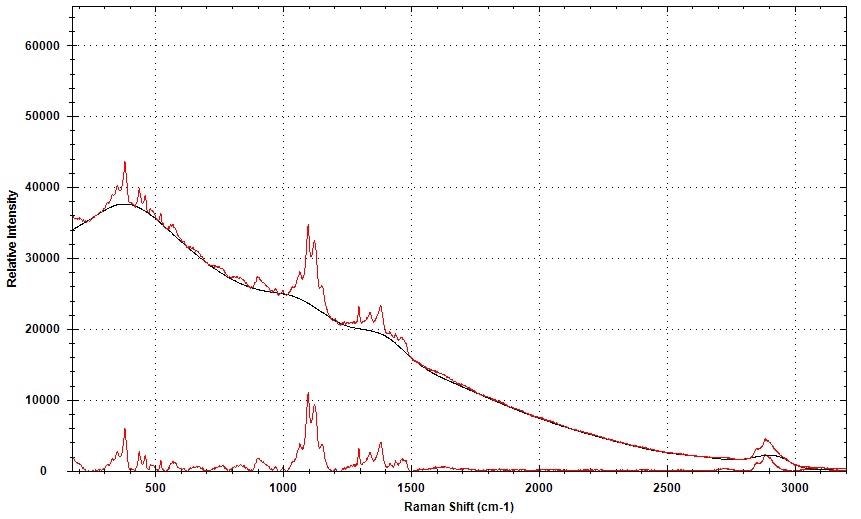
Figure 2. Raman spectral background removal using airPLS.
The Partial Least Squares (PLS) regression was employed to develop the model, while the Naltrexone HCl concentration (mg/tablet) was programmed as the response. The PLS regression was conducted in the same range as the Naltrexone HCl’s Raman bands, between 800 and 3000 cm-1. Figure 3 illustrates the good linear fit given by the model to the information (R2=0.9922, RMSEC = 0.01384).
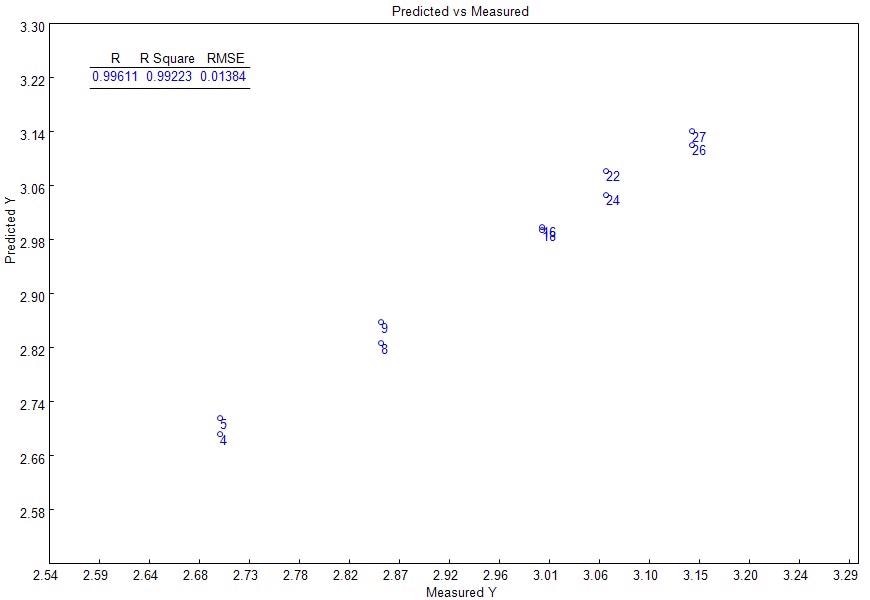
Figure 3. PLS model: measured vs. predicted curve.
A few sample spectra were set aside for cross-validation. The model renders a linear fit to the validation information (R2=0.76866, RMSECV= 0.05287). Table 2 shows the anticipated results on the two 3 mg tablets. Two spectra from all the samples were collected.
Table 2. Predicted results
| Prediction Tablet |
Predicted Naltrexone HCl (mg/tablet) |
| 3 mgT1-1 |
2.9668 |
| 3 mgT1-2 |
2.9244 |
| 3 mgT2-1 |
2.9038 |
| 3 mgT2-2 |
2.9296 |
Conclusion
The combination of chemometrics and Raman spectroscopy can be employed to create a quantitative method for the measurement of the concentration of Naltrexone HCl and other APIs in both final product tablets and blending mixtures. This method provides fast predictions of the concentration levels of APIs in blending mixtures. This enables on-line observation of blending processes.
The i-Raman Plus, with its stability, high resolution, and high sensitivity, conforms to the necessities of creating dependable Raman analysis methods.
The model’s accuracy can be directly influenced by the non-uniformity in the tablet or powder sample. In order to collect the calibration spectra numerous measurements in various places of the sample are required.
However, an approximation of the sample API uniformity can be evaluated when the actual concentration of the API in the prediction samples is available. It is recommended that common samples with known concentrations of APIs are tested to validate the stability of the hardware and the method at regular intervals.

This information has been sourced, reviewed and adapted from materials provided by B&W Tek.
For more information on this source, please visit B&W Tek.