Spectral (or optical) resolution is one of the most essential characteristics of a spectrometer. A system’s spectral resolution determines the maximum number of spectral peaks that can be resolved by the spectrometer. For instance, if a spectrometer with a wavelength range of 200 nm possessed a spectral resolution of 1 nm, the system would be able to resolve a maximum of 200 individual wavelengths (peaks) across a spectrum.
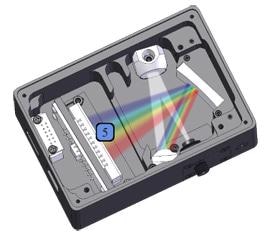
In dispersive array spectrometers, three key factors determine the spectral resolution of a spectrometer: the detector, the slit, and the diffraction grating. The detector determines the maximum size and number of discreet points in which the spectrum can be digitized; the slit determines the minimum image size formed in the detector plane by the optical bench; and the diffraction grating determines the total wavelength range of the spectrometer.
Measuring Spectral Resolution
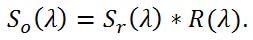
It must be noted that the observed signal (So) not only depends on the spectral resolution of the spectrometer (R), but also on the linewidth of the signal (Sr). Therefore, the observed resolution is the convolution of the two sources,
 |
Equation (1) |
The effect can be ignored if the signal linewidth is considerably greater than the spectral resolution, and it can be assumed that the resolution measured is the same as the signal resolution. However, when the signal linewidth is considerably narrower than the resolution of the spectrometer, the observed spectrum will be restricted by the spectrometer resolution.
In most applications, it is safe to assume that one of these limiting cases is what is being worked in, but this convolution cannot be ignored in high resolution Raman spectroscopy and other similar applications. For instance, if a spectrometer uses a laser with a linewidth of ~4 cm-1 and has a spectral resolution of ~3 cm-1, the observed signal will have a ~5 cm-1 linewidth. This is because the spectral resolutions are so close to one another (assuming a Gaussian distribution).
For this reason, users trying to measure the spectral resolution of a spectrometer should ensure that the measured signal is narrow enough to ensure that the measurement is resolution limited. This is achieved using a low pressure emission lamp, such as an Ar or Hg vapor, as the linewidth of these sources is much narrower than the spectral resolution of a dispersive array spectrometer. A single mode laser can be used if narrower resolution is needed.
After collecting the data from the low pressure lamp, the spectral resolution is determined at the full width half maximum (FWHM) of the peak of interest.
Calculating Spectral Resolution
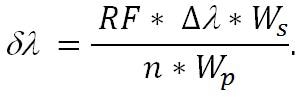
When measuring the spectral resolution (δλ) of a spectrometer, users should be aware of the four values - the spectral range of the spectrometer (Δλ), the slit width (Ws), the number of pixels in the detector (n), and the pixel width (Wp). It must also be noted that spectral resolution is defined as the FWHM.
A typical mistake when measuring spectral resolution is to ignore the fact that in order to determine a peak’s FWHM, at least three pixels are needed, and, as a result, the spectral resolution (assuming the Ws = Wp) is equal to three times the pixel resolution (Δλ/n).
This relationship can be further expanded to generate a value known as resolution factor (RF), which is determined by the relationship between the pixel width and the slit width. As would be anticipated, the resolution factor is 3 when Ws ≈ Wp. It is further reduce to 2.5 when Ws ≈ 2Wp, and continues to reduce until Ws > 4Wp when the resolution factor levels out to 1.5.
All of this data can be summarized by the following equation,
 |
Equation (2) |
For instance, the calculated resolution will be 1.53 nm if a spectrometer uses a 14 µm 2048 pixel detector, a 25 µm slit, and a wavelength range from 350 to 1050 nm.

This information has been sourced, reviewed and adapted from materials provided by B&W Tek.
For more information on this source, please visit B&W Tek.