In November 2011, NASA’s Jet Propulsion Laboratory (JPL) sent the Mars Science Laboratory rover called “Curiosity” to find out whether Mars had, or still has, an environment to support life. The unmanned rover will act as a robot geologist, acquiring information about the atmosphere, geology, environmental conditions on the surface of Mars, as well as the potential biosignatures on the red planet.
This article shows how NASA’s JPL scientists validated the dynamic response of the spectrometer inlet funnels on the rover using the Polytec PSV-400-3D Scanning Laser Vibrometer.
Curiosity will collect environmental and soil samples in situ, and utilize spectrometers, cameras, radiation detectors, atmospheric sensors and environmental sensors to investigate the samples on location. The data obtained will be sent to NASA researchers for further analysis and interpretation.
It is vital to prevent contamination of the robotic rover so that its data collection and analysis process produces accurate results. Therefore, flight and engineering models are separately tested to confirm design requirements of the various systems on board the rover.
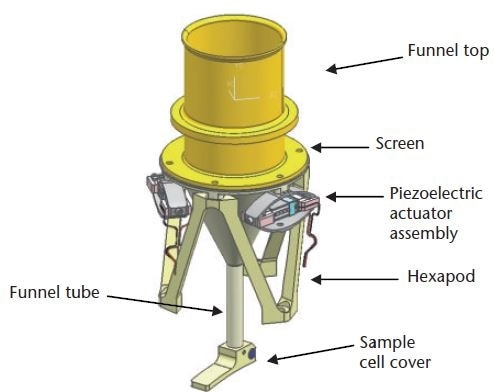
Figure 1. Inlet for soil samples.
The inlets (Figure 1) for the Sample Analysis on Mars Instrument Suite (SAM) and Chemistry and Mineralogy/ X-Ray Diffraction/ X-Ray Fluorescence Instrument (CheMin) utilize piezo-driven actuators at the base of the funnels to shake and sift the soil samples from the surface of Mars into the spectrometers for analysis.
Inaccurate data was produced by models that were tested previously using accelerometers. This was due to the mass loading effects of joining the transducers to the test article and restricting the amount of measurement locations possible. JPL scientists have developed a non-contact, dynamic performance testing method to determine the vibration levels of the spectrometer inlet funnels for design validation.
The Experimental Setup
During the validation process, the first step is to dynamically characterize the engineering models (Figure 2) that have been shown to effectively move the soil via the funnel. This data can then be compared to the predicted results from the Finite Element Model (FEM) by characterizing the vibration levels at numerous locations on the inlet funnel. This information provides a benchmark that can be compared later with the measurements on the flight model which otherwise cannot be tested with soil.
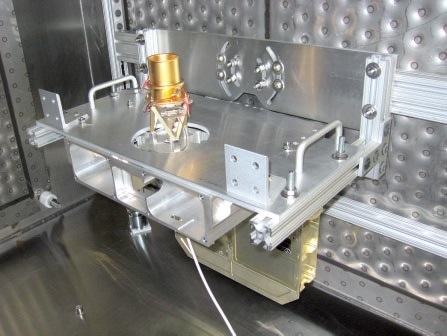
Figure 2. Engineering model of the sample funnel.
The engineering model was then tested with excitation to the actuators, using a 10.5 kHz – 12.5 kHz sweep over a duration of 5 seconds for the CheMin and a 100 Hz – 500 Hz sweep over a duration of 15 seconds for the SAM (Figure 3). Each of the three actuators had to be tested separately, followed by together in groups of two actuators exciting and all three actuators exciting. The Polytec PSV-400-3D was employed to determine the vibrations in three dimension (3D) on the engineering model, which, in turn, was oriented in a number of positions to enable line-of-sight access from the Polytec sensor heads to the CheMin inlet (both inside and outside), the SAM inlets, the CheMin collection screen and the CheMin funnel. The measurement locations included approximately 20 to 30 measurement points on the inlets, in addition to a few locations on the collection screen and funnel. Next, time-history data of the response to the sweep input was obtained in the X, Y and Z directions at each measurement location, as shown in Figure 4.
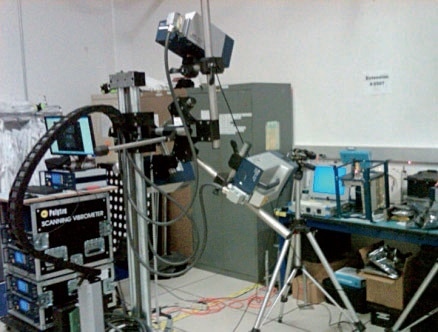
Figure 3. Vibration analysis of the engineering model
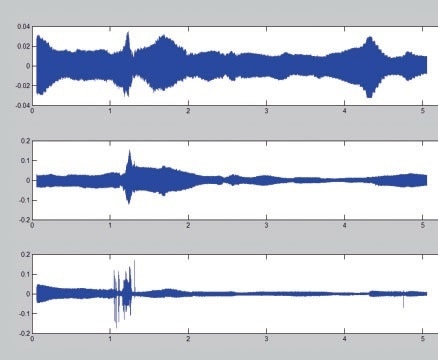
Figure 4. Frequency response of the model in X, Y, and Z directions
The flight hardware, comprising of the CheMin and SAM instruments, had to be compared to the engineering models tested so as to validate its functionality. The CheMin and SAM instruments are installed on the Mars-bound rover, which is then assembled in a clean room called the Spacecraft Assembly Facility (SAF). In order to prevent damage to the rover and any of its components, access was restricted to 1 m away from the rover. Then, the Polytec PSV-400-3D was completely cleaned and brought into the SAF, and then placed at a distance of 1.5 m away in front of the rover with a direct line of sight to the SAM and CheMin inlets, as shown in Figure 5. Measurements were then recorded using the same excitation and acquisition settings from the engineering model tests on the inside and outside rim of the SAM and CheMin inlets.
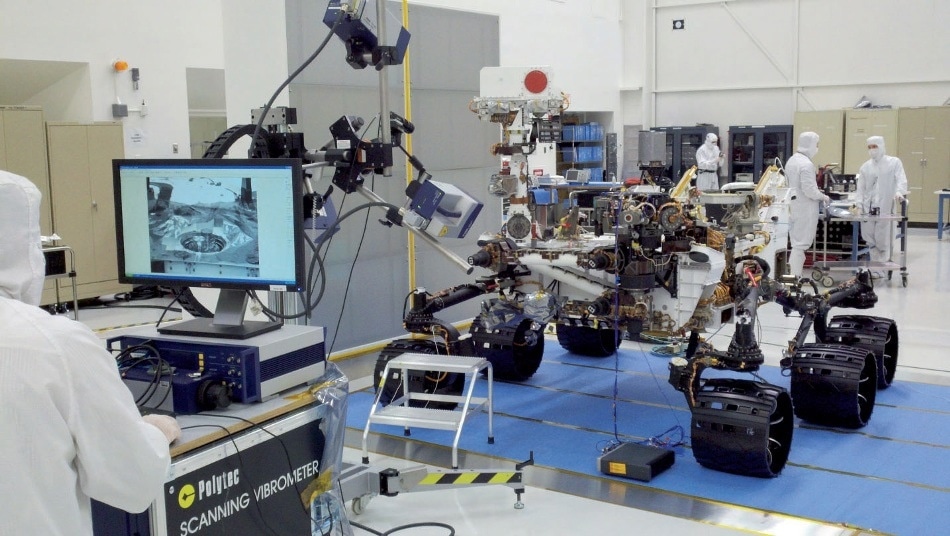
Figure 5. Vibration measurement on the inlets installed on the rover.
Results and Conclusion
JPL analyzed the data by low-pass filtering the time history data and calculating the RMS velocity over one chirp for individual measurement location. The data obtained was then compared between the flight hardware and the engineering models. Test results revealed that the dynamic behavior of the flight model corresponded with that of the engineering model, increasing the scientists’ confidence about the functional performance characteristics of the inlet actuation system.

This information has been sourced, reviewed and adapted from materials provided by Polytec.
For more information on this source, please visit Polytec.