The dual beam near-infrared process analyzers (NIR-O™ and ClearView™ db) from Process Insights can be configured to offer real-time measurement of ethylene oxide (EO) gas during sterilization cycles. Ethylene oxide is generally used in the pharmaceutical and healthcare industries as an alternative to steam sterilization or other chemical sterilization techniques. In order for the sterilization to take place, an adequate concentration of EO must be present for an ample length of time. The efficiency of the process is enabled by the humidity or presence of water vapor. The required concentration of EO also relies on the process’ temperature. If the temperature is higher, the concentration of EO required for sterilization to occur will be lower. The ability to measure the concentrations of EO and water vapor during the complete sterilization cycle offers analytical validation that all sterilization conditions have been satisfied.
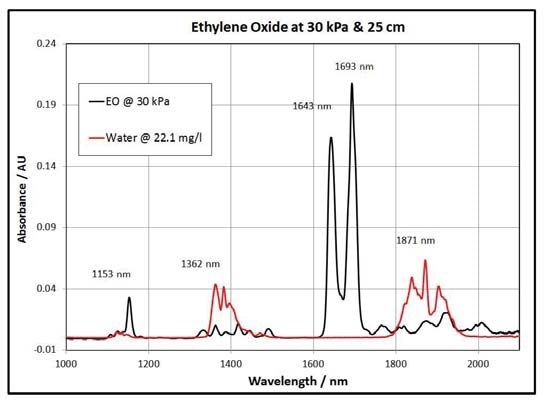
Figure 1. Ethylene Oxide and Water Spectra
Experiment
Figure 1 shows the near-infrared spectra of EO at 30 kPa and water vapor at 22.1 mg/l. These spectra were quantified with a Process Insights NIR-O using a 25 cm pathlength gas probe. Furthermore, strong EO gas absorbance peaks were easily identified at 1643 and 1693 nm. Water vapor peaks occur at 1362 nm and 1871 nm and do not interfere considerably with the distinct EO peaks. Figure 2 shows a range of near-infrared spectra collected at varying EO pressures.
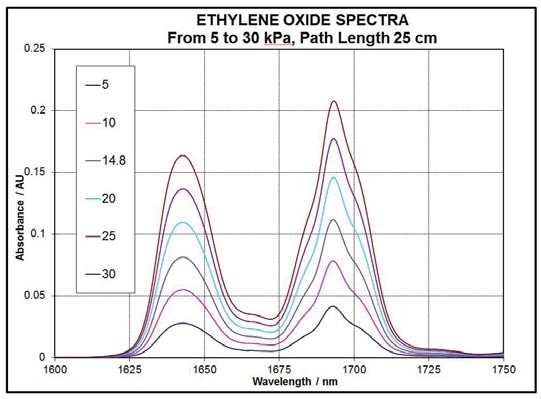
Figure 2. Ethylene Oxide – varying pressures
Analysis
Routine baseline correction pre-processing was next applied to the calibration data set. Regression analysis applied at the 1643 nm peak represented in Figure 3, clearly shows how EO can be effectively predicted by NIR spectroscopy. This simple one wavelength measurement yielded an accuracy of ±0.15 kPa. The same approach can be applied to the ClearView db dual beam filter photometer, which will give similarly accurate results. The measurement of the concentration of water vapor for this application is analogous to the water vapor measurement carried out by Process Insights’ Hydrogen Peroxide Vapor (HPV) analyzer. For more information on the measurement levels, refer the product literature (#1058).
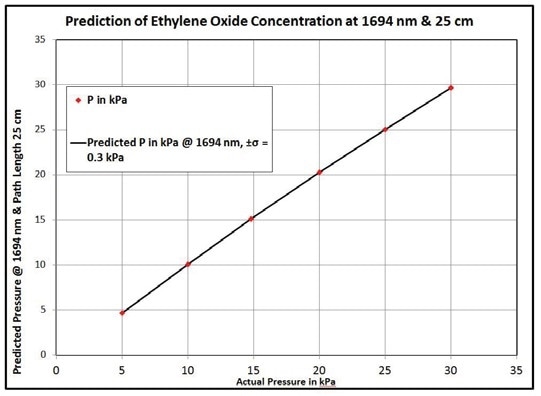
Figure 3. Regression Results - NIR-O
Discussion
Both analyzer instrument technologies - photometer or spectrometer - can offer reliable and accurate in situ measurement of the concentration of ethylene oxide during sterilization. The application of fiber optics to deploy the optical gas sensor enables remote, and thus safe continuous measurements to occur, both in explosive environments or under vacuum conditions. The differentiating factor for selecting one analyzer system over the other is usually the measurement environment and other measurement parameters that are of interest. The NIR-O full spectrum analyzer is designed in such a way that it can more easily perform under fluctuating conditions including interfering gas species. For single or binary component gas mixtures, the ClearView db is more appropriate. Both types of analyzer systems will yield similar signal-to-noise ratios and accurate results for both ethylene oxide and water vapor. Both systems can give the confidence and documentation needed to meet regulatory compliance in the sterilization application.
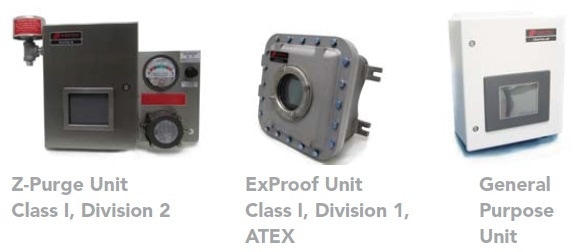
Spectrometer: NIR-O Process Analyzer
Photometer: ClearView db Configurations
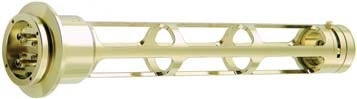
Vapor Probe (G-SST), 50 cm Pathlength Probe

This information has been sourced, reviewed and adapted from materials provided by Process Insights – Optical Absorption Spectroscopy.
For more information on this source, please visit Process Insights – Optical Absorption Spectroscopy.