Polyurethanes, one of the most versatile polymers available, can be found in elastomers, liquid coatings and paints, soft flexible foam, rigid insulation, elastic fiber, and many other materials. Nowadays, polyurethanes can be found in almost everything that can be touched - chairs, desks, clothes, cars, beds, appliances, footwear, the insulation in the roof, walls, and moldings in homes. The reaction between diisocyanates and dialcohols produces polyurethanes (Figure 1).
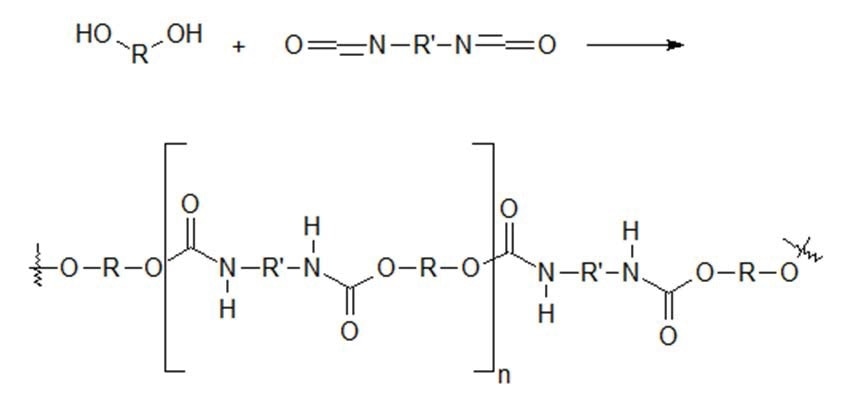
Figure 1. Polyurethane Reaction
Near-Infrared (NIR) spectroscopy is used for measuring many aspects of polyurethane production. This article explains the potential applications of Process Insights hardware and software tools for key measurements in polyurethane production by means of fiber optic-based NIR spectroscopy. Fiber optics is used by Process Insights analyzer systems to enable the sample probe to be positioned in distant locations away from the spectrophotometer itself. NIR spectroscopic methods can be implemented in real time directly in process monitoring or as laboratory procedures. In both instances, NIR is a time- and money-saving alternative to conventional techniques. This method also provides the advantage of increased safety among conventional techniques.
NIR-O™ Process Insights’ Spectrometer NIR Online Process Analyzer
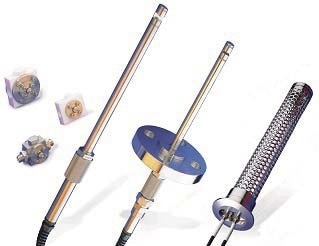
Process Insights’ optically matched probes and flow cells
A specific publication on the use of NIR for measuring hydroxyl content of polyols can be found in Process Insights literature (Article #3013–Hydroxyl Number in Polyols).
Measurement Background
Absorbance bands in the NIR region of the electromagnetic spectrum result from overtones and combinations of the C-H, N-H, and O-H fundamental bands in the mid-infrared. Usually, the NIR spectra of a series of samples of standards are used to create a quantitative model that will be used for measuring the composition (or property) in forthcoming samples based only on the NIR spectrum of the sample. The optimization of data preprocessing is the primary model development step for improving the accuracy of the model. These preprocessing steps are usually in the form of derivative calculation or baseline correction, but may contain more complicated calculations. After submitting the pre-processed spectra and concentration or property data to the Unscrambler® software, a calibration model is created using PLS regression methodology. For a discussion of PLS and other multivariate calibration methods, refer Martens & Naes1 and ASTM E16552.
Polyurethane Raw Materials
Polyurethanes contain the repeating unit:
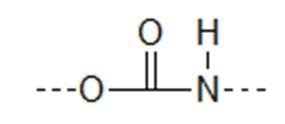
As mentioned above, polyurethanes are produced by reacting diisocyanates with dialcohols. As a basic case of raw material measurement potential, the spectra of para and ortho tolyl-isocyanate were measured using 2-mm path probes and 10-mm path probes. The 10-mm path probe generates spectral data in the 1000–600 nm region that would be appropriate for quantitative measurements while the 2-mm path spectra possess useful data in the expanded NIR region of 1600–2000 nm. The region that proves to be most useful will rely on the property being measured and on the other materials present in the reaction. Shown in Figure 2 are the isocyanate spectra using the 10-mm path probe in comparison to para and ortho chlorotoluene. This reveals the isocyanate peak at nearly 1490 nm and some probable difference between the isomers of the isocyanate. Shown in Figure 3 are the spectra of the same materials using the 2-mm path probe extending the wavelength range to 2050 nm. Similar differences are shown by these spectra, with a band due to the isocyante observed at approximately 1870 nm.
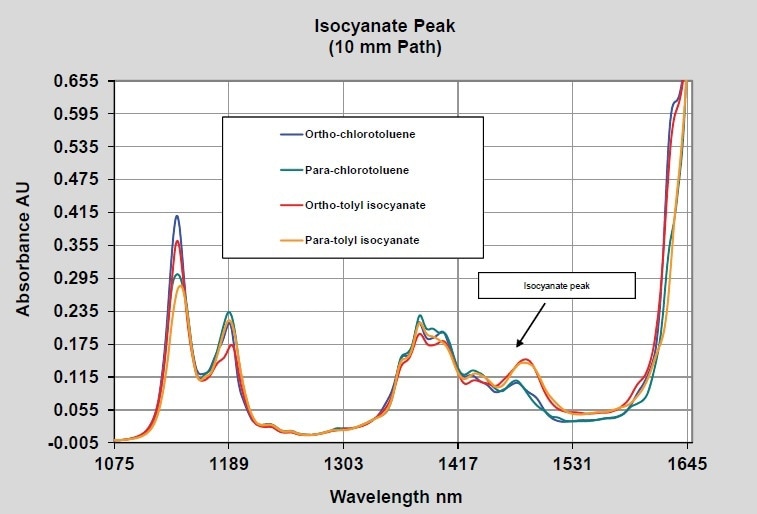
Figure 2. Isocyanates–10 mm pathlength–Short wavelength NIR
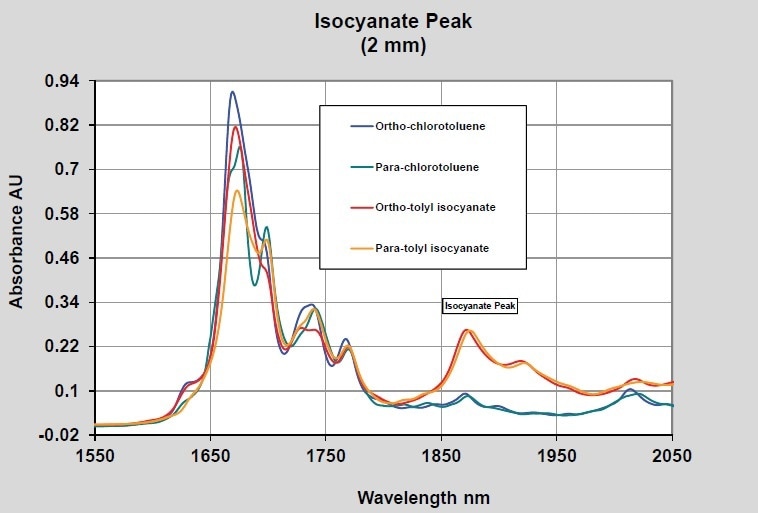
Figure 3. Isocyanates–2 mm pathlength–Long wavelength NIR
When considering the measurements of the final product, polyurethanes can actually be considered as an ester or an amide of carbonic acid (carbamate). The spectrum of phenyl and methyl carbamate was measured to study this functional group. The spectra of well-ordered methyl carbamate and phenyl carbamate at 10% concentration in acetone are illustrated in Figures 4 and 5. Furthermore, two pathlengths are again used to demonstrate data in both the long and the short wavelength NIR regions.
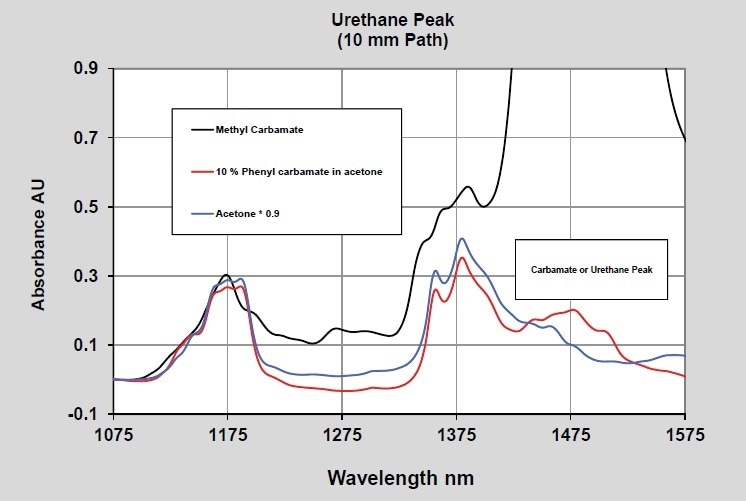
Figure 4. Carbamate - 10 mm pathlength - Short wavelength NIR
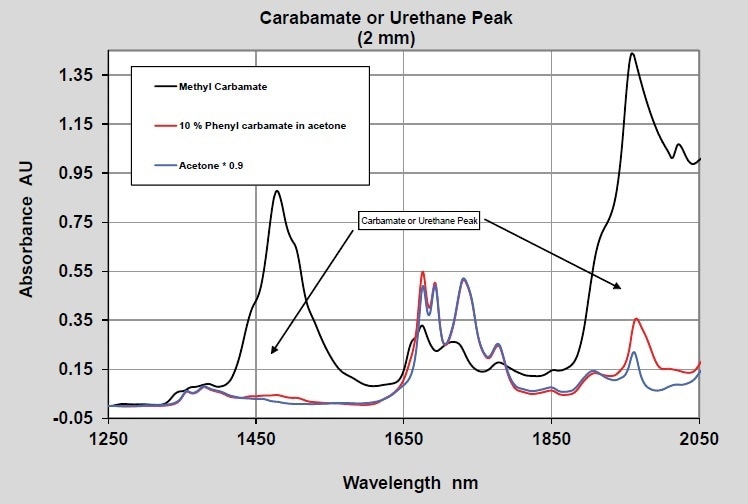
Figure 5. Carbamate - 2 mm pathlength - Long wavelength NIR
The peaks emerging from the carbamate are observed at 1960 nm and 1475 nm in the 2-mm and 10-mm pathlength spectra, respectively. The wavelength separation between the carbamate bands and the isocyanate bands should be adequate to enable quantitative measurements when both are present.
Conclusion
In previous studies, the use of NIR spectroscopy to measure the OH number of polyols has been demonstrated to be both fast and reliable utilizing the Process Insights software and hardware tools. The feasibility of additional measurements in polyurethane systems is highlighted by the data shown here. The use of remote spectroscopic measurement techniques reduces the need for conducting laboratory measurements and offers analyses in real time. These techniques can be implemented in reactor systems to control key properties at the time of reaction and to establish the reaction endpoint thereby adding to the cost and value savings. It is important to study the accuracy of any such measurements in more detail. For more detailed information on system specifications or feasibility studies, customers can contact a Process Insights technical or sales specialist.
References
- H. Martens, T. Naes, Multivariate Calibration, John Wiley & Sons, 1989.
- ASTM E1655 Standard Practices for Infrared, Multivariate, Quantitative Analysis.

This information has been sourced, reviewed and adapted from materials provided by Process Insights – Optical Absorption Spectroscopy.
For more information on this source, please visit Process Insights – Optical Absorption Spectroscopy.