Portland cement is a controlled chemical mixture, comprising calcium, silicon, aluminum, iron and low quantities of other components. The mixture is combined with gypsum in the final grinding process to modulate the setting time. Lime and silica constitute around 85% of the mass. Limestone, shells, chalk combined with shale, clay, slate or blast furnace slag, silica sand, and iron ore are common materials implemented in its production.
The robustness and setting time of cement is governed by the efficiency of the chemical reactions among its components. At the same time, however, this efficiency is strongly affected by the particle shapes of the constituent materials. Consequently, a prediction of the behavior of the final product necessitates a comprehensive understanding of the particle shape composition.
Conventional non-imaging size analysis equipment will record sizes based on the assumption that all particles are round or spherical. Such data might thus distort the manner in which those particles will flow in production, or operate in their eventual usage.
The sample comprises multiple categories of particle shapes, most likely correlating with the various materials in the mixture. The challenge is to utilize the power of imaging to designate the particle sub-populations, according to size and shape.
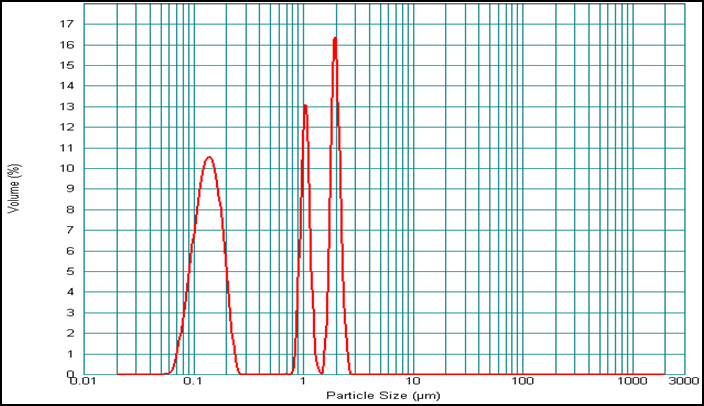
Typical Size-only result from a commonly used size analyzer
Image Credit: Vision Analytical Inc.
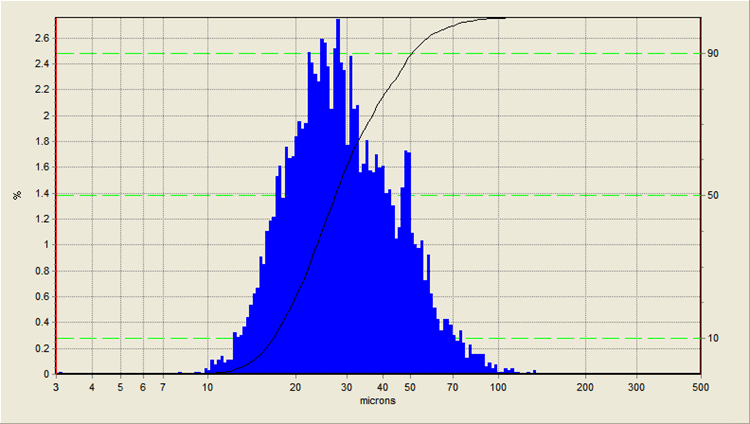
This particle represented as “round” would report as “100.1 μm in diameter”.
Image Credit: Vision Analytical Inc.
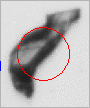
Here we see a typical “diameter” histogram reporting a smooth size distribution centered at about 30 µm.
Image Credit: Vision Analytical Inc.
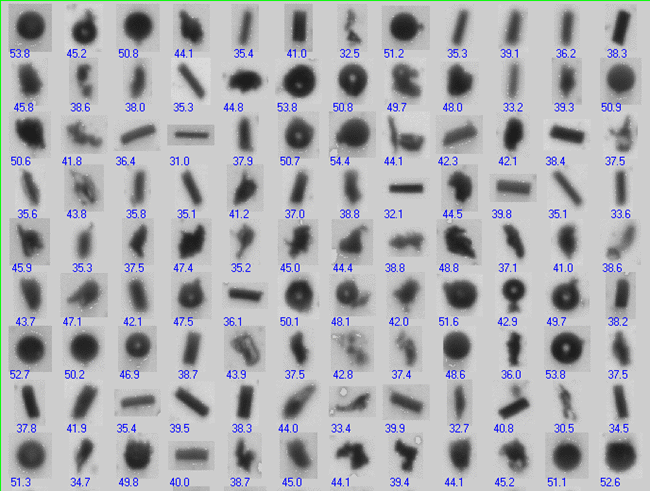
In looking at a sampling of the particle thumbnails, it is obvious that this sample is made up of more than one kind of particle shape. The “diameter” data may mislead the user into thinking the particles are all the same type when they are not.
Image Credit: Vision Analytical Inc.
| |
Measure |
Range of acceptance |
| Applicable Measures |
Equivalent Circular Area Diameter |
3 – 3000 microns |
| Circularity |
0 to 1.0 |
| Smoothness |
0 to 1.0 |
| Bounding Rectangle Width |
3 – 1000 microns |
| Bounding Rectangle Length |
10 – 3000 microns |
| Feret Aspect Ratio |
1 – 10.0 |
| Opacity |
0 to 1.0 |
Procedures and Results
The following Particle Insight data indicates a selection of the size and shape outcomes for the Cement sample. These represent overall results for the total sample.
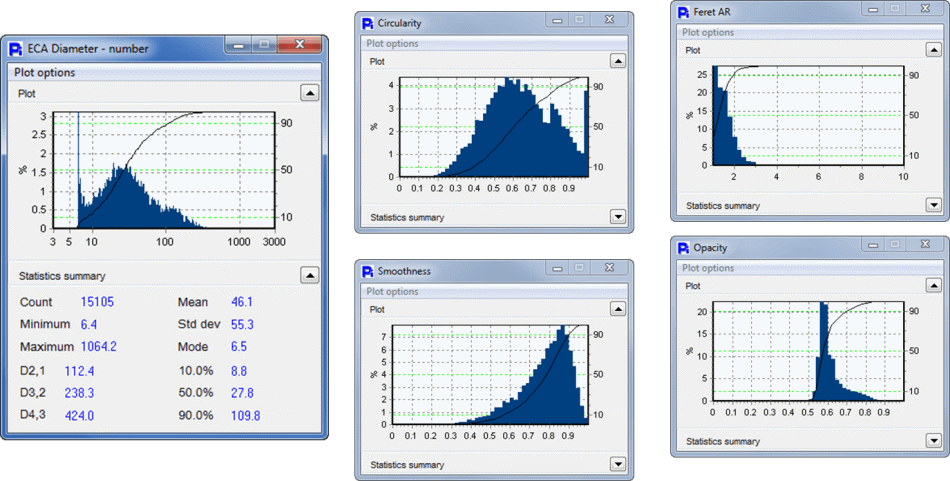
Image Credit: Vision Analytical Inc.
To signify how to utilize Smoothness to distinguish subgroups, the total sample has been separated into a “smooth” taxonomy and a “rough” taxonomy. Observing the thumbnail particle images, the logic of this separation becomes obvious; the two subgroups are discernible. The Smoothness measure will then be able to efficiently distinguish these subgroups. In the following screenshots, 0.84 is utilized as the Smoothness dividing line. The Comprehensive Statistics form exhibits typically implemented means and measures of spread.
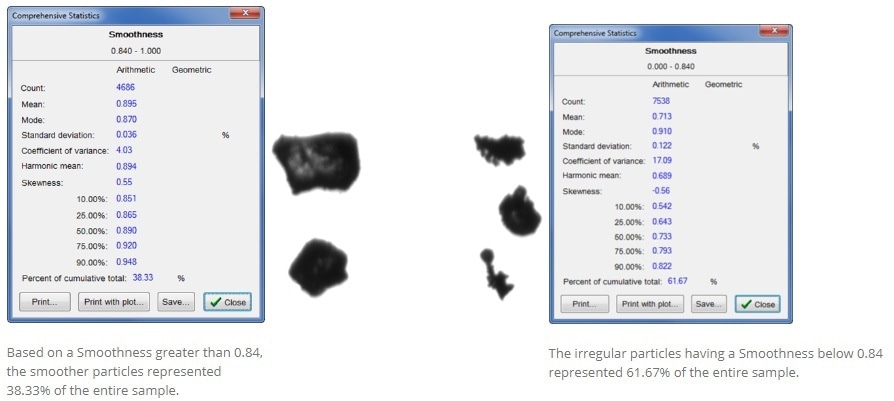
Image Credit: Vision Analytical Inc.
In addition to the statistics overview presented herein, the Particle Insight post-processing function enables the presentation of the total distribution of any, or all, of the measures utilized, for all particle subgroups. It also permits the observation of particle thumbnails and two measure correlation diagrams.
Taking the “very smooth” subgroup as the sole focus, a lower limit of 0.89 on Smoothness can be implemented in the post-run processing function. To specifically examine the “very rough” subgroup, a lower limit of 0.60 on Smoothness can be implemented. It is also possible to observe an interdependence between particle smoothness and generalized size.
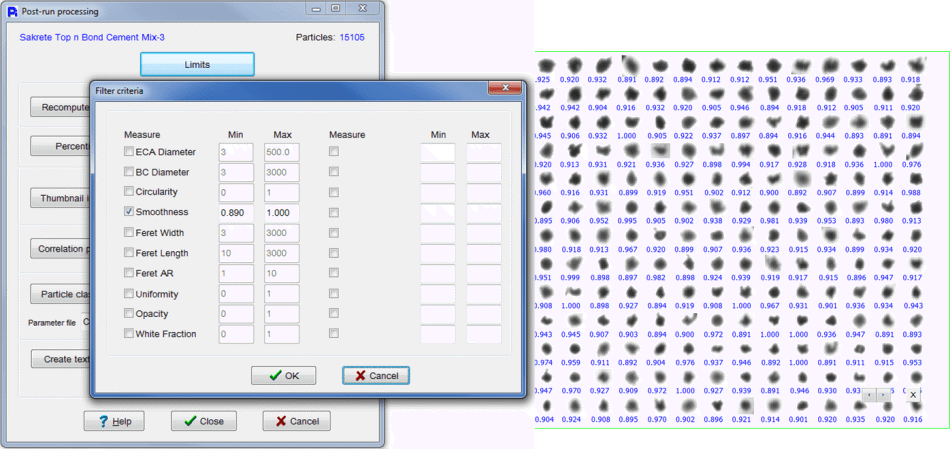
Image Credit: Vision Analytical Inc.
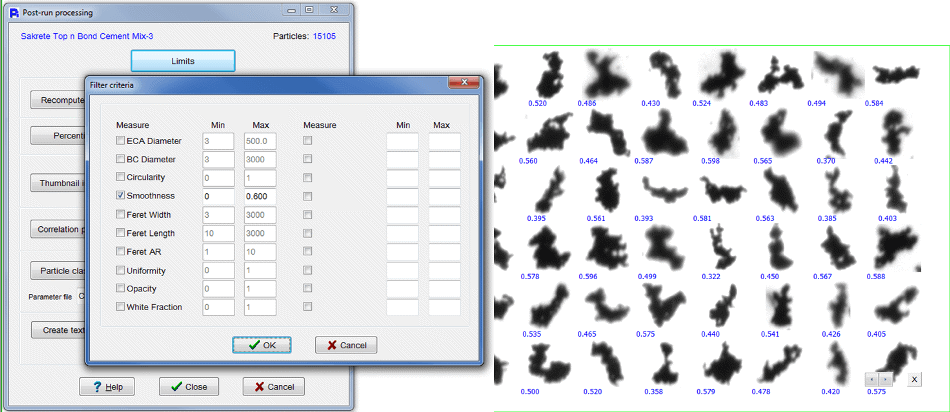
Image Credit: Vision Analytical Inc.
The scatter graph demonstrates that, generally speaking, there is an inverse correlation between smoothness and size; the smallest objects are the smoothest ones. The interdependence of any two size or shape measures with each other can be correlated by the Particle Insight post processing.
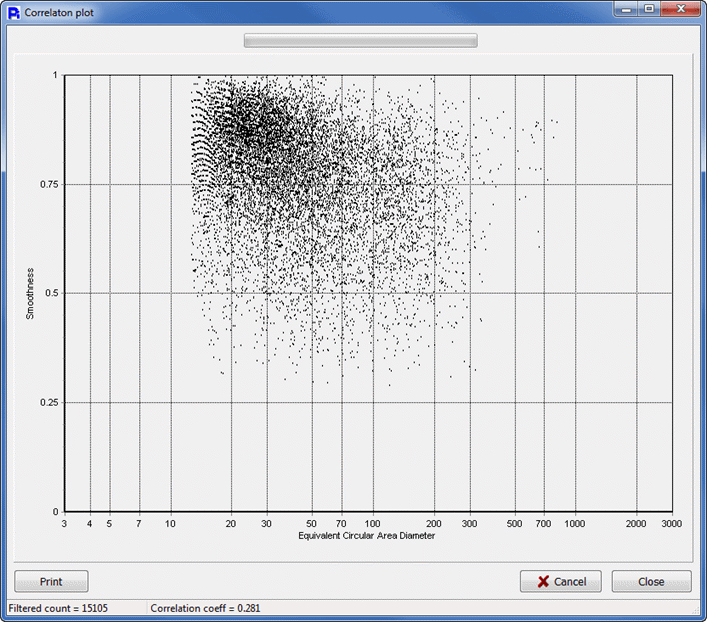
Image Credit: Vision Analytical Inc.
Conclusions
To examine the cement sample more closely, three or more particle subgroups, characterized by size and shape, could be separated out in the post-run processing. For instance, the almost-round subgroup has high circularity and smoothness, alongside low aspect ratio. This subgroup could be distinguished by imposing an upper or lower limit, or both, on the three specified measures in the “Filter Criteria” window.
The “stick-like” objects would possess low circularity with medium smoothness. The particularly irregular shapes could be distinguished with the use of the smoothness measure. Additional modifications could be introduced by filtering the majority, or even all, of the measures utilized.

This information has been sourced, reviewed and adapted from materials provided by Vision Analytical Inc.
For more information on this source, please visit Vision Analytical Inc.