Propenal (also known as acrolein) is the simplest unsaturated aldehyde and exists at room temperature as a clear liquid. Propenal can be produced from propylene and is used as a reagent in chemical syntheses or as a biocide.
Following production of acrolein from propenal it must be separated from water and impurities via distillation using a process similar to that in Figure 1.
To evaluate the purity of the acrolein produced the acetaldehyde and water concentration in the final product must be measured. In addition, acrolein is toxic and the solvent outflows must also be monitored.
Near-infrared spectroscopy (NIR) can be used to provide instantaneous in-situ analysis of the process using an affordable dual-beam, three wavelength NIR photometer with a fiber optic in-stream probe. This system allows process control to take place, meaning the water content of the acrolein produced can be accurately controlled.
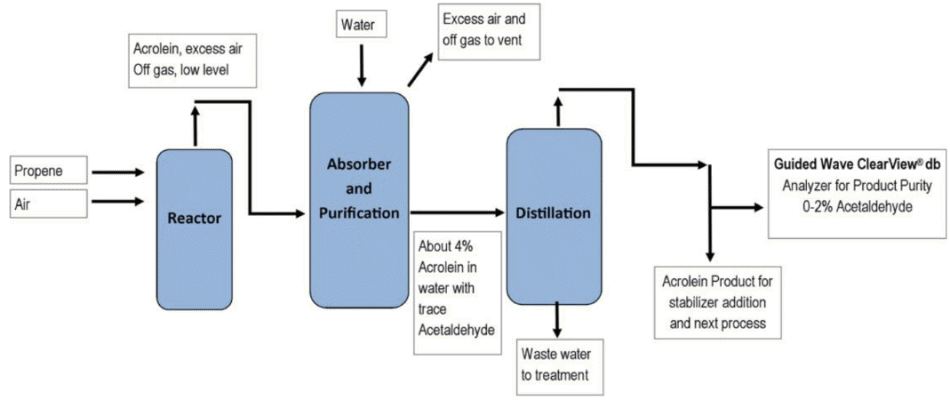
Figure 1. Acrolein Production Process Diagram
Background
The near infrared region of the electromagnetic spectrum contains frequencies specific to the combination bands of C-H, N-H and O-H bonding modes. Measurement of the NIR spectrum of acrolein samples with known water concentrations allows a calibration curve to be drawn, which can be used to measure future samples and determine their water content.
Analysis systems from Process Insights use fiber optic transmission, which allows the sample probe to be located in-stream, with the spectrometer itself located elsewhere.
Table 1. Water concentration
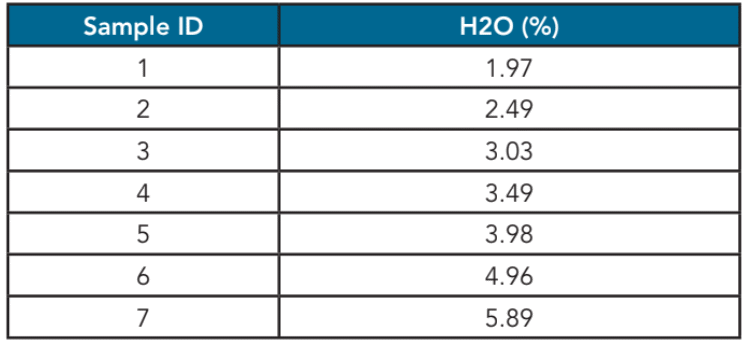
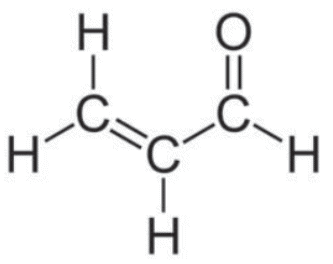
Figure 2. Acrolein
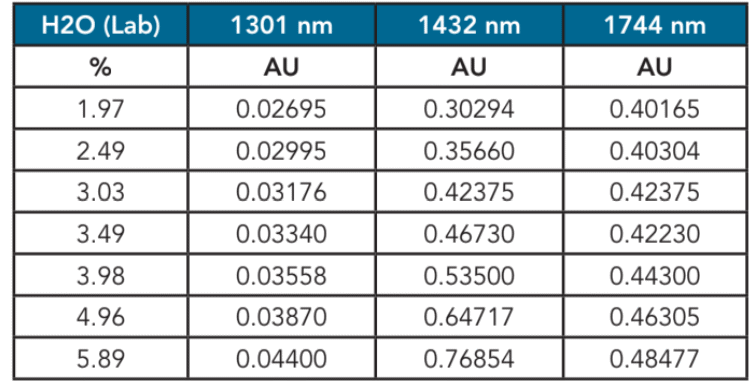
Table 2. Water in Acrolein Absorbance Data
Experimental
A range of samples of acrolein with water concentrations between 2 – 6% (Figure 2, Table 1) were used to demonstrate the measurement feasibility. The ClearView db photometric analyzer was used with a Process Insights 10 mm flow cell to take measurements.
The ClearView db was equipped with filters at 1301 nm, 1432 nm, and 1744nm. These filters have been determined to be optimal for this measurement.
Analysis
Table 2 shows the absorbance data for acrolein samples. The data shows good linearity to the data based on water concentration. The data taken at 1,301 nm was used as a baseline correction and the data taken at 1,432 nm and 1,744 nm was used to model the linear regression for water. Table 3 shows the results.
The error for the determination of water concentration is around 0.03%. Figure 4 shows the results of a similar experiment carried out for acetaldehyde concentration.
Discussion
Using NIR photometry alongside fiber optic probes represents a perfect method for the on-line, dynamic analysis of water and acetaldehyde in acrolein.
Using just 1 or 2 sample points the ClearView db filter photometer, from Process Insights, can be used to measure low concentration levels of water and acetaldehyde concentration in real-time.
The in-situ analysis method of the ClearView db means that manual sampling of toxic acrolein does not need to occur, providing a safe and accurate method of analyzing and controlling acrolein production.
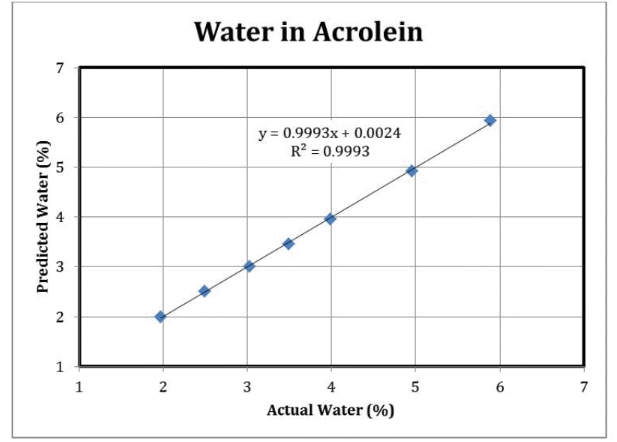
Figure 3. Water Results: ClearView db
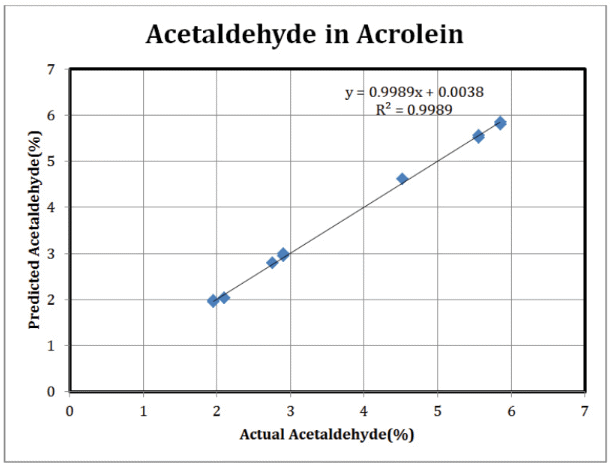
Figure 4. Acetaldehyde Results: ClearView db

This information has been sourced, reviewed and adapted from materials provided by Process Insights – Optical Absorption Spectroscopy.
For more information on this source, please visit Process Insights – Optical Absorption Spectroscopy.