Rechargeable metal-based batteries (Li, Na and Al) are some of the most diverse systems for high-energy storage. These energy systems, however, have various drawbacks, such as the deposition and formation of dendrite during repeated cycles of charge and discharge. A large number of studies aiming to find a dendrite-free and deposition-free system for lithium batteries have been carried out. Those studies even include the use of novel materials, such as 3D structures and carbon nanofibers.1,2
This article explores the distribution of Lithium on electrode surfaces in different chemical environments. The conventional surface analysis technique (XPS) is employed in order to encompass a large area and provide quantitative information about the distribution of surface species. XPS imaging and Argon cluster depth profiling are also used to explore the lateral and depth distribution.
Experimental
XPS was performed using the state-of-the-art AXIS spectrometer. Survey spectra were acquired over a large energy range of 0 to 1200 eV. To ensure there is no charge build-up, the co-axial charge neutralizer was used. Argon cluster ions (20 kV Ar500+) were used to perform depth profiling.3 The stitched imaging mode enabled the acquisition of high-spatial resolution XPS images over a large surface area. This imaging mode combines fast parallel imaging with stage movements.
In this example a 3x3 stitched image using a 400 μm field of view provided an image of 1.2 x 1.2 mm. Small-spot spectroscopy was performed using a 110 micron diameter aperture. The total acquisition time for each survey spectrum was 4 minutes. After synthesis of the electrodes, CV experimentation was performed via the three-electrode system.4
Results
Figure 1 presents the XPS survey spectra acquired at the different areas of the electrode surface. The expected elements - Mg, Li, Cu, O and C were present on the surface after the experiment. Their presence was detected with peak identification. Furthermore, there were low levels of other elements, such as F, Na, Cl, S (see Table 1), but those are considered to be a result of contamination.
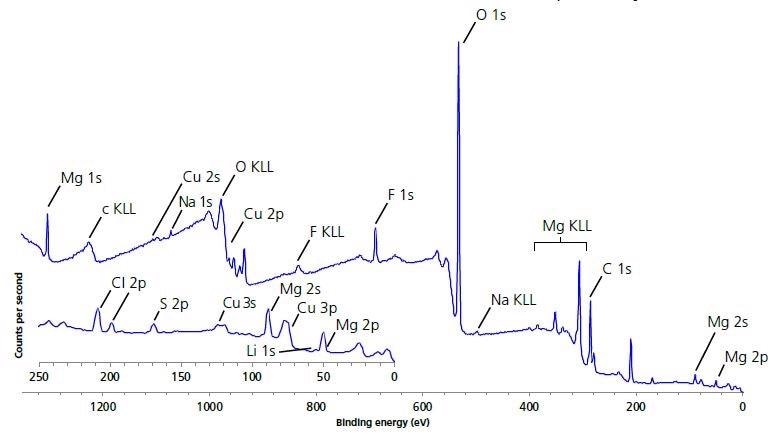
Figure 1. Large area survey spectrum of electrode surface.
Table 1. Surface quantification of as-received electrode surface.
| Element |
Quantification |
| Atomic conc. [%] |
| Mg |
3.91 |
| Cu |
3.79 |
| O |
55.00 |
| F |
5.15 |
| C |
20.81 |
| S |
0.99 |
| Cl |
0.53 |
| Na |
0.24 |
| Li |
9.57 |
The distribution of Li into the bulk of the electrode surface was further explored using Argon cluster depth profiling. A high-energy cluster (20 kV Ar500+) ion provided the quick and in-depth profiling, while at the same time ensuring the limited migration of Li ions. The migration of light Li ions is a common problem with monatomic Argon depth profiling. Figure 2 represents the distribution of surface species as a function of etch time.
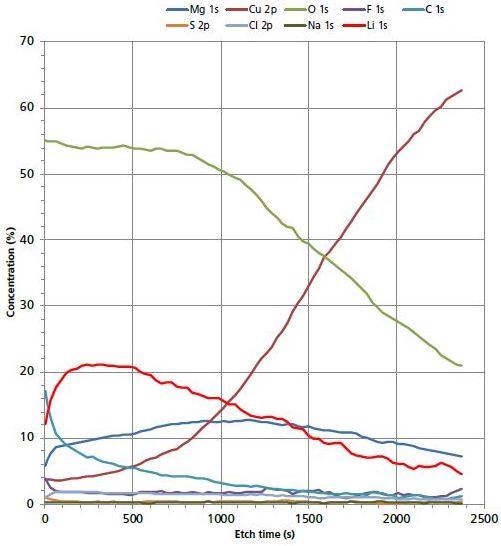
Figure 2. 20 kV Ar500+ depth profile of electrode surface.
After the first few etch cycles the concentration of Li increases to > 20 at. %. Further sputter removal of surface material shows a decrease in Li concentration. This is an indication that Li is segregated in the uppermost region of the electrode surface and there is a decrease in the Li concentration once the depth profile has interfaced with the Cu bulk electrode surface. There is not much evidence to suggest that Li has migrated deeper into the electrode.
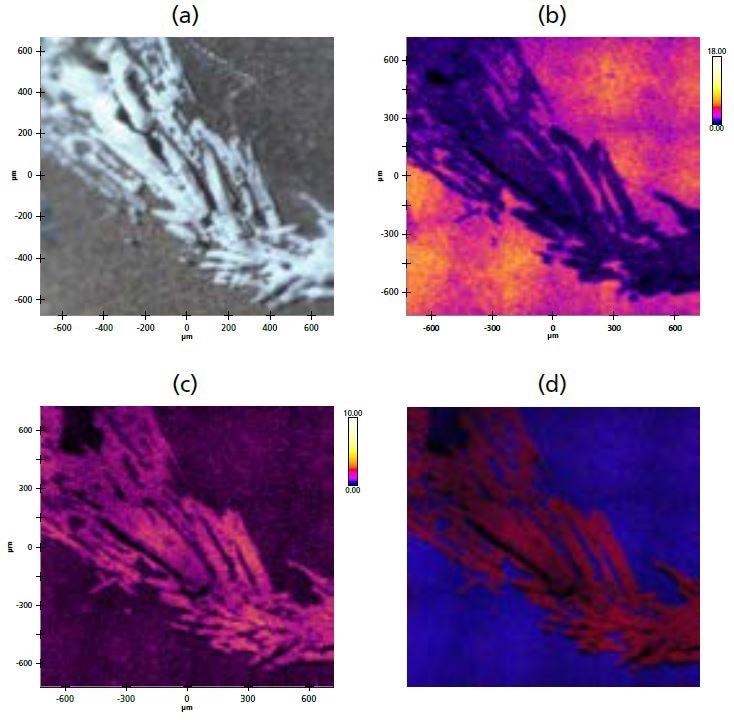
Figure 3. (a) Optical microscope image of surface crystallites; (b) XPS stitched image of Mg; (c) XPS stitched image of Cl; (d) overlay of Mg (blue) and Cl (red).
White crystallite structures were identified on the electrode surface (Figure 3a) using the in-situ optical microscope on the analysis chamber. It is possible to observe the relative distributions and accumulations of particular species on the surface by acquiring a peak-minus-background stitched images at fixed energies for the different elements. In order to investigate the composition of the crystallite structures found, XPS images were acquired for various elements identified in the survey spectrum (Figure 3b-c).
The images show that the crystallite regions exhibit a higher concentration of CI in comparison to the rest of the electrode surface. In contrast, the concentration of Mg shows a decrease. Figure 3d shows a combined overlay image of the two elemental XPS images, highlighting the distinctive distribution differences of the elements.
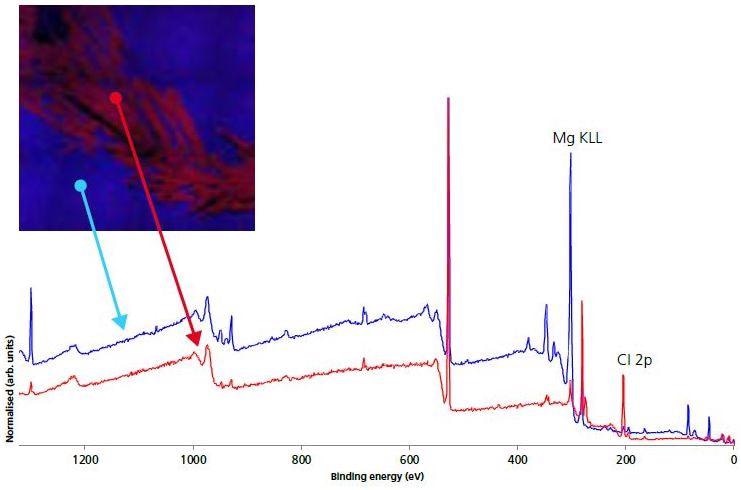
Figure 4. 110 micron small-spot survey spectra on electrode (blue) and crystallite (red) areas.
Furthermore, Figure 4 presents the small-spot, selected area spectroscopy both on and off the crystalline regions acquired with the use of XPS images for navigation. Elemental quantification from the electrode and crystalline survey spectra are shown in Table 2.
Table 2. Surface quantification of electrode and crystallite areas.
| Element |
Quantification |
| BLUE (electrode) |
RED (crystalline) |
| Mg 1s |
5.24 |
0.97 |
| Cu 2p |
2.46 |
0.36 |
| O 1s |
50.49 |
42.30 |
| F 1s |
3.79 |
1.52 |
| C 1s |
31.59 |
34.56 |
| S 2p |
1.18 |
0.46 |
| Cl 2p |
2.66 |
10.75 |
| Li 1s |
2.00 |
8.97 |
| Na 1s |
0.59 |
0.11 |
The images indicate that there is a high accumulation of Cl on the crystalline areas as well as a significantly higher concentration of Li. The atomic concentration of F, Na, S were depleted in the crystalline regions. To further represent the nature of these crystalline areas, high-energy resolution, chemical state, and spectra were acquired (Figure 5).
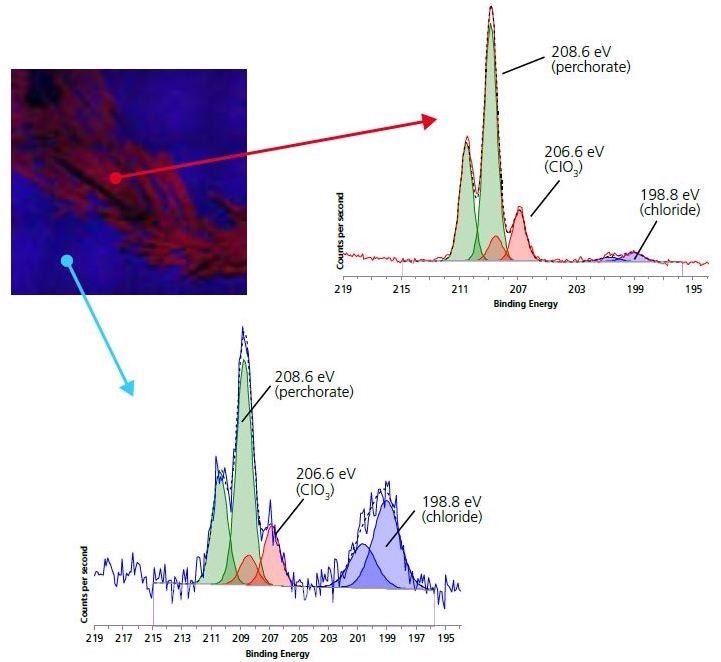
Figure 5. 110 micron small-spot spectroscopy of Chlorine 2p region for electrode (blue) and crystallite (red) areas.
As expected, there is a significantly higher Cl signal for the crystalline areas. Peak-fitting analysis of both spectra indicates three different chemical environments for Cl: perchlorate ion (208.6 eV), chloride (198.8 eV) and chlorate (206.6 eV). The most dominant state of chlorine for the crystalline areas is in the perchlorate ion. This, along with the increased concentration of Li in the region and the decreased concentrations of other non-electrode surface species, indicates that the white crystalline species is Lithium perchlorate.
Conclusion
XPS was used to investigate the distribution of Li and other surface species on Cu electrode surfaces. The argon cluster depth profiling made it possible to observe that the Li is contained within the surface of the electrode and has not penetrated into the bulk. Crystalline species of Lithium perchlorate were identified on the surface of the electrode.
Acknowledgments
Many thanks to Dr. Narayanan at TFIR who provided both samples along with a fruitful discussion.
References and Further Reading
- J. Xiang, Y. Huang et al., Nano Energy, 42, 2017, 262-268.
- Y. Yuan, C. Wu et al., Energy Storage Materials, 16, 2019, 411-418.
- http://www.kratos.com/products/arn-ion-source [accessed 3/1/19].
- Bard, Allen J.; Larry R. Faulkner (2000-12-18). Electrochemical Methods: Fundamentals and Applications (2 ed.). Wiley. ISBN 0-471-04372-9.

This information has been sourced, reviewed and adapted from materials provided by Kratos Analytical, Ltd.
For more information on this source, please visit Kratos Analytical, Ltd.